台积电2026年第二季度业绩点评
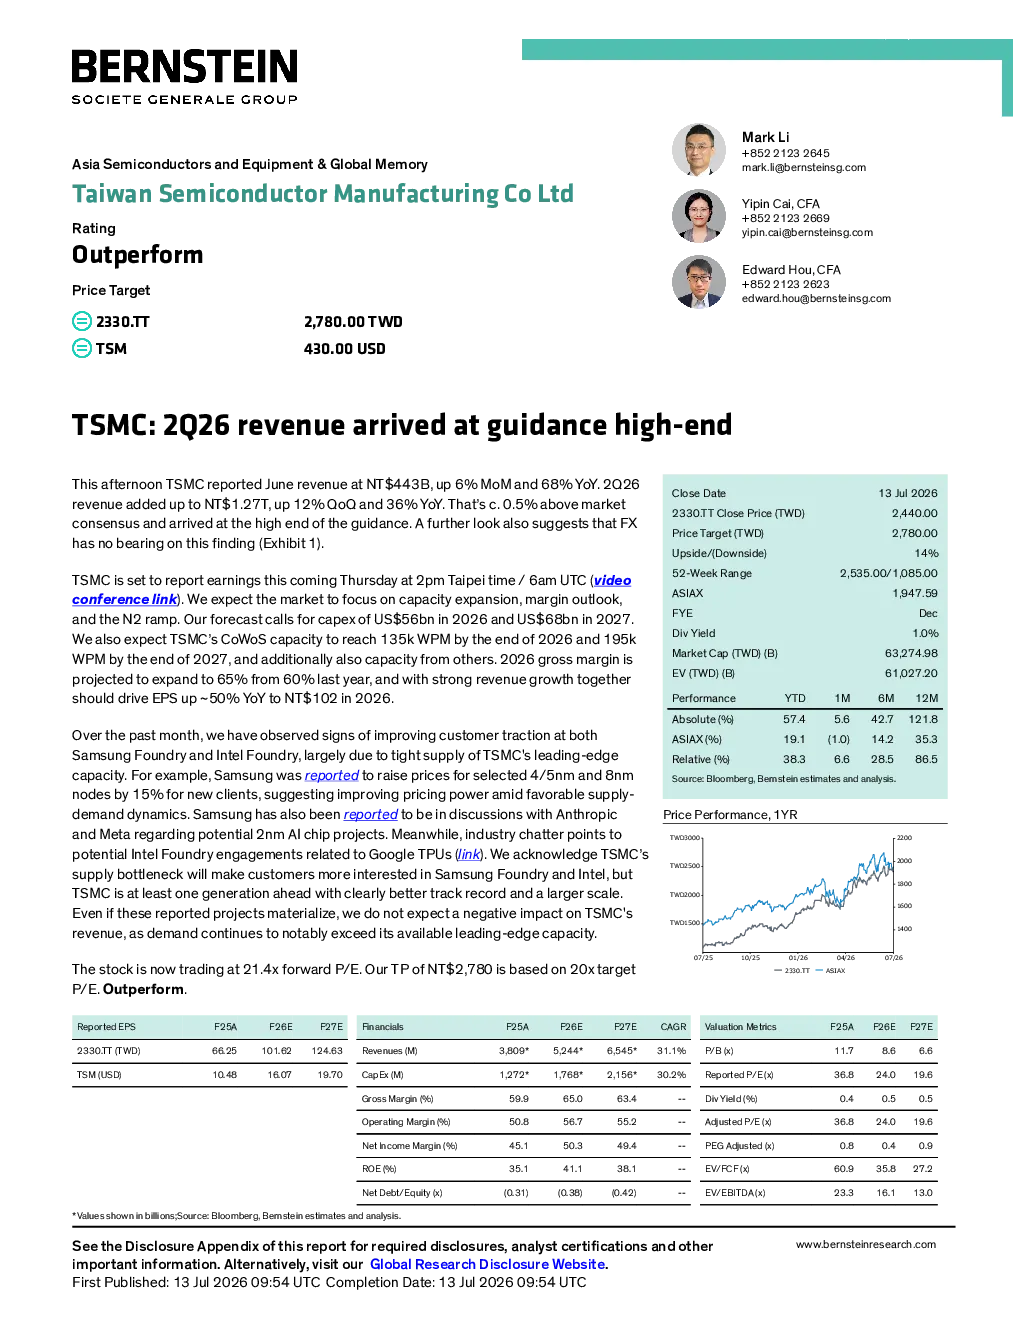
Asia Semiconductors and Equipment & Global Memory Taiwan Semiconductor Manufacturing Co Ltd Yipin Cai, CFA+852 2123 2669yipin.cai@bernsteinsg.com Outperform Edward Hou, CFA+852 2123 2623edward.hou@bernsteinsg.com Price Target TSMC: 2Q26 revenue arrived at guidance high-end This afternoon TSMC reported June revenue at NT$443B, up 6% MoM and 68% YoY. 2Q26revenue added up to NT$1.27T, up 12% QoQ and 36% YoY. That’s c. 0.5% above marketconsensus and arrived at the high end of the guidance. A further look also suggests that FXhas no bearing on this finding (Exhibit 1). TSMC is set to report earnings this coming Thursday at 2pm Taipei time / 6am UTC (videoconference link). We expect the market to focus on capacity expansion, margin outlook,and the N2 ramp. Our forecast calls for capex of US$56bn in 2026 and US$68bn in 2027.We also expect TSMC’s CoWoS capacity to reach 135k WPM by the end of 2026 and 195kWPM by the end of 2027, and additionally also capacity from others. 2026 gross margin isprojected to expand to 65% from 60% last year, and with strong revenue growth togethershould drive EPS up ~50% YoY to NT$102 in 2026. Over the past month, we have observed signs of improving customer traction at bothSamsung Foundry and Intel Foundry, largely due to tight supply of TSMC's leading-edgecapacity. For example, Samsung wasreportedto raise prices for selected 4/5nm and 8nmnodes by 15% for new clients, suggesting improving pricing power amid favorable supply-demand dynamics. Samsung has also beenreportedto be in discussions with Anthropicand Meta regarding potential 2nm AI chip projects. Meanwhile, industry chatter points topotential Intel Foundry engagements related to Google TPUs (link). We acknowledge TSMC’ssupply bottleneck will make customers more interested in Samsung Foundry and Intel, butTSMC is at least one generation ahead with clearly better track record and a larger scale.Even if these reported projects materialize, we do not expect a negative impact on TSMC'srevenue, as demand continues to notably exceed its available leading-edge capacity.More reports @wechat: Hillwood2024 The stock is now trading at 21.4x forward P/E. Our TP of NT$2,780 is based on 20x targetP/E.Outperform. EXHIBIT 1:TSMC reported 2Q26 revenue at NT$1.27T,reaching its guidance high-end & exceeding consensusby c. 0.5%. Our analysis also suggests FX has no bearingon this finding. INVESTMENT IMPLICATIONS We rate TSMCOutperform. Price target isNT$2,780.00. BERNSTEIN TICKER TABLE I. REQUIRED DISCLOSURES References to "Bernstein" or the “Firm” in these disclosures relate to the following entities: Bernstein Institutional Services LLC(April 1, 2024 onwards), Sanford C. Bernstein & Co., LLC (pre April 1, 2024), Bernstein Autonomous LLP, BSG France S.A. (April 1,2024 onwards), Sanford C. Bernstein (Hong Kong) Limited盛博香港有限公司,Sanford C. Bernstein (Canada) Limited, SanfordC. Bernstein (India) Private Limited (SEBI registration no. INH000006378), Sanford C. Bernstein (Singapore) Private Limited,Sanford C. Bernstein Japan KK(サンフォード・C・バーンスタイン株式会社)and analysts employed by Société GénéraleAfrica Technologies & Services to produce Bernstein research under a Global Services Agreement in place between Bernsteinand Société Générale. Bernstein is part of a joint venture between Société Générale (SG) and AllianceBernstein, L.P. (AB). Unless specifically notedotherwise, for purposes of these disclosures, references to Bernstein’s “affiliates” relate to both SG and AB and their respectiveaffiliates. VALUATION METHODOLOGY Taiwan Semiconductor Manufacturing Co Ltd We set a NT$2,780 1-year target price using a P/E multiple of 20x against our forward Q5-Q8 EPS estimate of NT$139. Wederive our PT for secondary ticker (TSM.US) by dividing the primary PT by FX and arrive at US$430. RISKS Taiwan Semiconductor Manufacturing Co Ltd Downside risks are: (1) Market-wide multiple contraction. (2) Intel regains and keeps technology superiority. (3) Geopoliticaluncertainties RATINGS DEFINITIONS, BENCHMARKS AND DISTRIBUTION EQUITY RATINGS DEFINITIONS Bernstein brand The Bernstein brand rates stocks based on forecasts of relative performance for the next 12 months versus the S&P 500 forstocks listed on the U.S. and Canadian exchanges, versus the Bloomberg Europe Developed Markets Large and Mid Cap PriceReturn Index EUR (EDME) for stocks listed on the European exchanges and emerging markets exchanges outside of the AsiaPacific region, versus the Bloomberg Japan Large and Mid Cap Price Return Index USD (JPL) for stocks listed on the Japaneseexchanges, and versus the Bloomberg Asia ex-Japan Large and Mid Cap Price Return Index (ASIAX) for stocks listed on the Asian(ex-Japan) exchanges -unless otherwise specified.More reports @wechat: Hillwood2024 The Bernstein brand has three categories of ratings: •Outperform: Stock will outpace the market index by more than 15 pp•Market-Perform: Stock will perform in line with the market index to within +/-15 pp•Under