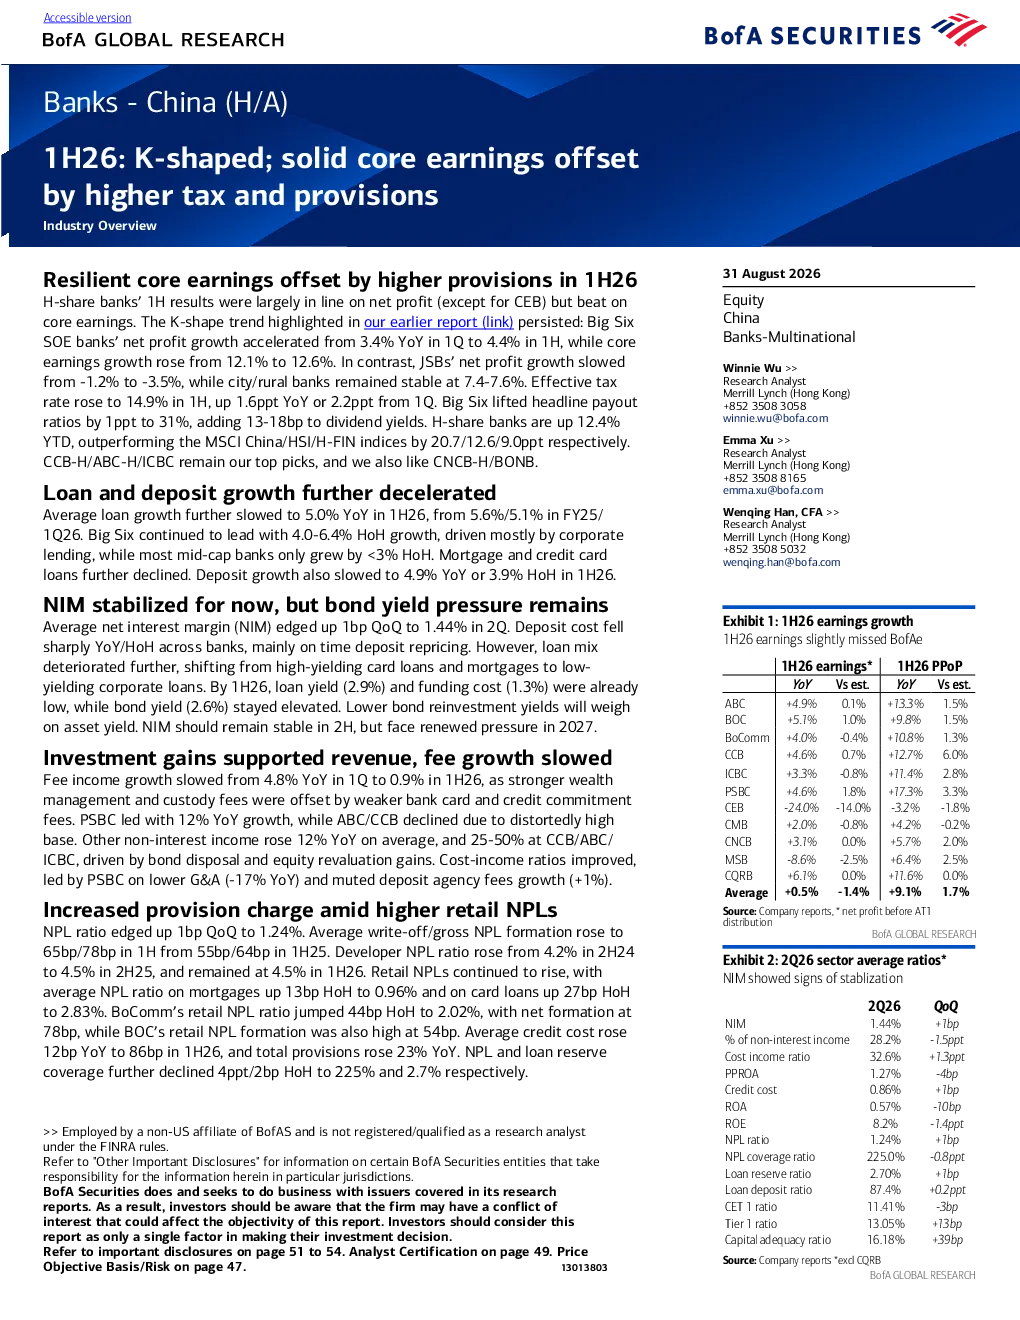
1H26: K-shaped; solid core earnings offsetby higher tax and provisions Industry Overview 31 August 2026 Resilient core earnings offset by higher provisions in 1H26H-share banks’1H results were largely in line on net profit (except for CEB) but beat on EquityChinaBanks-Multinational core earnings. The K-shape trend highlighted inour earlier report (link)persisted: Big SixSOE banks’net profit growth accelerated from 3.4% YoY in 1Q to 4.4% in 1H, while coreearnings growth rose from 12.1% to 12.6%. In contrast, JSBs’net profit growth slowedfrom -1.2% to -3.5%, while city/rural banks remained stable at 7.4-7.6%. Effective taxrate rose to 14.9% in 1H, up 1.6ppt YoY or 2.2ppt from 1Q. Big Six lifted headline payoutratios by 1ppt to 31%, adding 13-18bp to dividend yields. H-share banks are up 12.4%YTD, outperforming the MSCI China/HSI/H-FIN indices by 20.7/12.6/9.0ppt respectively.CCB-H/ABC-H/ICBC remain our top picks, and we also like CNCB-H/BONB. Winnie Wu>>Research AnalystMerrill Lynch (Hong Kong)+852 3508 3058winnie.wu@bofa.com Emma Xu>>Research AnalystMerrill Lynch (Hong Kong)+852 3508 8165emma.xu@bofa.com Loan and deposit growthfurther deceleratedAverage loan growthfurther slowed to 5.0% YoY in 1H26, from 5.6%/5.1% in FY25/ Wenqing Han, CFA>>Research AnalystMerrill Lynch (Hong Kong)+852 3508 5032wenqing.han@bofa.com 1Q26. Big Six continued to lead with 4.0-6.4% HoH growth, driven mostly by corporatelending, while most mid-cap banks only grew by <3% HoH. Mortgage and credit cardloans further declined. Deposit growth also slowed to 4.9% YoY or 3.9% HoH in 1H26. NIMstabilized for now, but bond yield pressure remainsAveragenet interest margin (NIM) edged up 1bp QoQ to 1.44% in 2Q. Deposit cost fell sharply YoY/HoH across banks, mainly on time deposit repricing. However, loan mixdeteriorated further, shifting from high-yielding card loans and mortgages to low-yielding corporate loans. By 1H26, loan yield (2.9%) and funding cost (1.3%) were alreadylow, while bond yield (2.6%) stayed elevated. Lower bond reinvestment yields will weighon asset yield. NIM should remain stable in 2H, but face renewed pressure in 2027. Investment gains supported revenue, fee growth slowedFee income growth slowed from 4.8% YoY in 1Q to 0.9% in 1H26, as stronger wealth management and custody fees were offset by weaker bank card and credit commitmentfees. PSBC led with 12% YoY growth, while ABC/CCB declined due to distortedly highbase. Other non-interest income rose 12% YoY on average, and 25-50% at CCB/ABC/ICBC, driven by bond disposal and equity revaluation gains. Cost-income ratios improved,led by PSBC on lower G&A (-17% YoY) and muted deposit agency fees growth (+1%). Increased provision charge amid higher retail NPLsNPL ratio edged up 1bp QoQto 1.24%. Average write-off/gross NPL formation rose to 65bp/78bp in 1H from 55bp/64bp in 1H25. Developer NPL ratio rose from 4.2% in 2H24to 4.5% in 2H25, and remained at 4.5% in 1H26. Retail NPLs continued to rise, withaverage NPL ratio on mortgages up 13bp HoH to 0.96% and on card loans up 27bp HoHto 2.83%. BoComm’s retail NPL ratio jumped 44bp HoH to 2.02%, with net formation at78bp, while BOC’s retail NPL formation was also high at 54bp. Average credit cost rose12bp YoY to 86bp in 1H26, and total provisions rose 23% YoY. NPL and loan reservecoverage further declined 4ppt/2bp HoH to 225% and 2.7% respectively. NIM showed signs of stablization Share price performance and valuation H-share banks as a whole rose by 12.4% YTD (without including the dividend yield) andoutperformed the MSCI China/HSI/H-FIN Index by 20.7ppt/12.6ppt/9.0ppt respectively.The weighted average share price of the sector dipped down from the recent high at>154% in late Jul to 152% now, with valuation at 0.55x P/B, 3.6x P/PPOP, and 6.0x P/E.We believe the absolute upside in the near-term is limited, although the bank sector stilloffers good downside protection in any China market corrections. We continue to preferICBC/ABC-H/CCB-H, given their strong balance sheets, steady earnings growth, andrelatively attractive dividend yield. H-share bank and market performance YTD Over the past 19 years, H-share banks have tended to be defensive and have lower betathan non-bank financials and the broader China markets. They underperformed non-bankfinancials and the MSCI China index in the bull markets (eg 2007, 2012, 2017, 2019,2020, 2025), while outperformed in the down or flattish markets (eg 2008, 2014, 2016,2018, 2021, 2022, 2023, 2026YTD). H-share banks’ relative performance vs markets Source:Bloomberg *Performance is not adjusted for dividends Valuation of the H-share bank sector suffered long-term de-rating, but re-rated in thepast 30mths. It recently troughed at 0.34x forward P/B, 3.2x P/E and 1.9x P/PPOP in Jan-2024, similar to the previous low levels at 0.35x P/B, 3.1x P/E and 1.8x P/PPOP in Oct-2022. The sector currently trades at 0.55x forward P/B, 6.0x P/E and 3.6x P/PPOP. Gross dividend yield of the