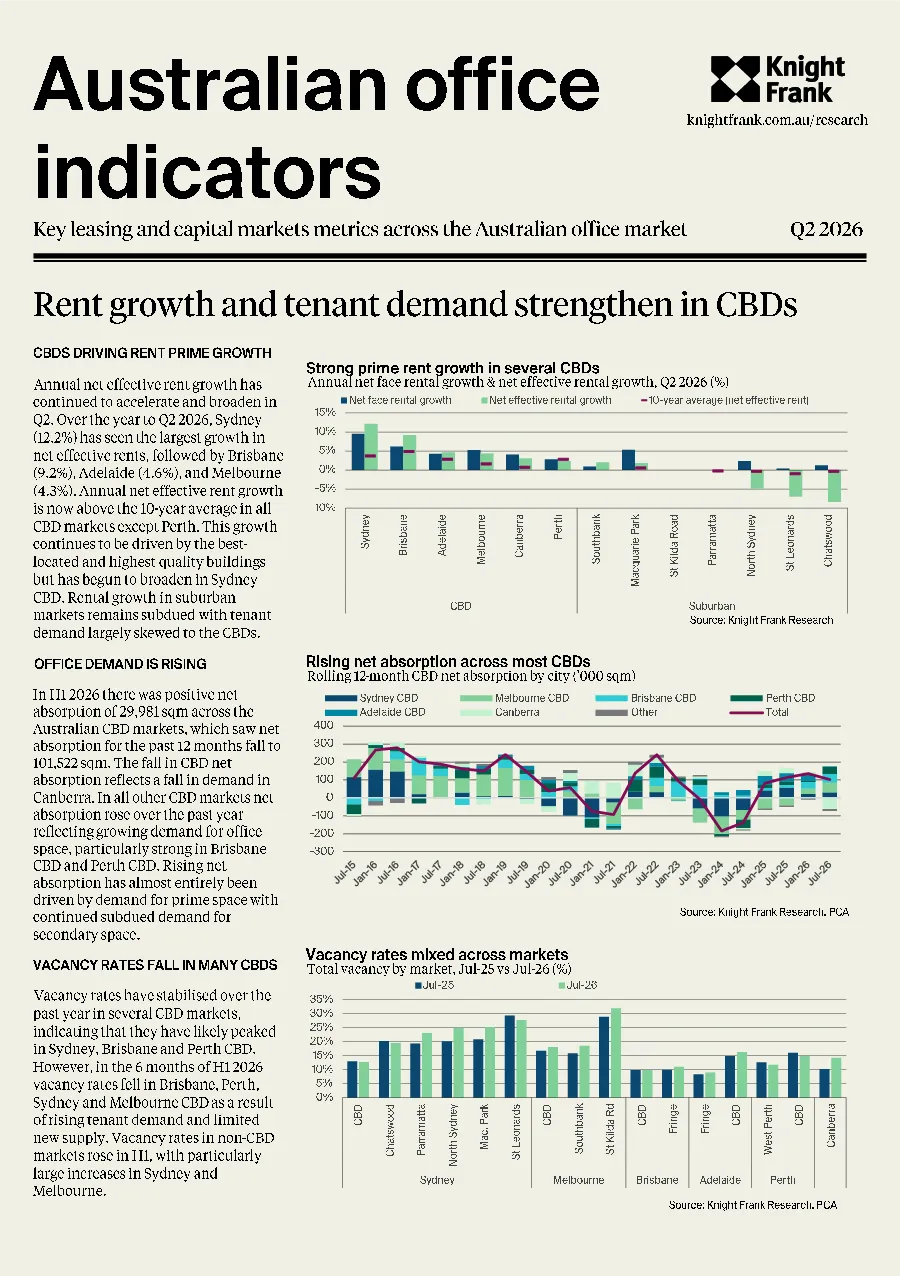
Key leasing and capital markets metrics across the Australian office market Rent growth and tenant demand strengthen in CBDs CBDS DRIVING RENT PRIME GROWTH Strong prime rent growth in several CBDsAnnual net face rental growth & net effective rental growth, Q2 2026 (%) Annual net effective rent growth hascontinued to accelerate and broaden inQ2. Over the year to Q2 2026, Sydney(12.2%) has seen the largest growth innet effective rents, followed by Brisbane(9.2%), Adelaide (4.6%), and Melbourne(4.3%). Annual net effective rent growthis now above the 10-year average in allCBD markets except Perth. This growthcontinues to be driven by the best-located and highest quality buildingsbut has begun to broaden in SydneyCBD. Rental growth in suburbanmarkets remains subdued with tenantdemand largely skewed to the CBDs. OFFICE DEMAND IS RISING In H1 2026 there was positive netabsorption of 29,981 sqm across theAustralian CBD markets, which saw netabsorption for the past 12 months fall to101,522 sqm. The fall in CBD netabsorption reflects a fall in demand inCanberra. In all other CBD markets netabsorption rose over the past yearreflecting growing demand for officespace, particularly strong in BrisbaneCBD and Perth CBD. Rising netabsorption has almost entirely beendriven by demand for prime space withcontinued subdued demand forsecondary space. VACANCY RATES FALL IN MANY CBDS Vacancy rates have stabilised over thepast year in several CBD markets,indicating that they have likely peakedin Sydney, Brisbane and Perth CBD.However, in the 6 months of H1 2026vacancy rates fell in Brisbane, Perth,Sydney and Melbourne CBDas a resultofrising tenant demand and limitednew supply. Vacancy rates in non-CBDmarkets rose in H1, with particularlylarge increases in Sydney andMelbourne. Key data points Prime market averages–Q2 2026 Sales volumes subdued Elevated uncertainty weighs on office transaction activity •Office investment activitywas subdued in Q2 2026with $1.7 billion of closed transactions. Activity was driven predominantly bynon-CBD markets:In North Sydney,BGO JV Investaacquired 100 Mount St for $558 million fromDexus; ASA Real Estate Partnersbought 54 Wellington St in East Melbourne for $108 million from Impact Investment Group; and a private bought 9 Help St inChatswood for $90 million. A further c$1.6billion in Q2 transactions remain under contract, Charter Hall’s c$540 million purchaseof the remaining 50% share of 5 office assets in the O’Connell Block, and Centuria’s 50% share in 680 George St for $480m. •Average prime CBD yields rose in Q2 2026reflecting a softer investment demand. Yields remained steady in Sydney CBD andBrisbane CBD as robust rent growth supports increased investor confidence. However, yields softened further in Melbourne(+13bps), Adelaide (+16bps) and Perth (+32bps) with upward pressurecoming from a combination ofhigher borrowing rates, lowerrent growth, and increased uncertainty leading to a more cautious approach among investorswithin these markets. •The Middle East conflict continued to drive elevated geopolitical uncertainty in investment markets during Q2 2026, and higherinflation has led to a sharp rise in borrowing rates and kept office investment demand subdued. •Over the medium-term, the fundamentals of a significantly supply constrained environment persist, net effective rents are risingat an above average pace, and the longer-term trajectory for interest rates point lower around late-2027–2028. Together, this allpoints to a supportive environment for offices investment over the medium-term. Office investment remains subdued Primeoffice yields b y CBD(%) Divergent capital growth across cities Annual change in officecapital values , Q2-25 to Q2-26 Strong effective rent growth Rent growth is expanding beyond core precincts within CBDs •Average prime net face rents continued to rise in most CBDs in Q2, with strong growth in Adelaide (3.1%), followed by Sydney(1.8%) and Perth (1.7%). Rents remained stable in Q2 in Perth (0.3%), and Adelaide (0.1%) and Canberra (0%). •Incentives were mixed across the CBDs in Q2. Prime incentives fell by 0.6% in Sydney (34.9%, gross) and 0.6% in Adelaide (33.8%,gross). Melbourne saw prime incentives rise by 0.4% to 48.1% (net) while incentives remained steady in all other CBDs. •Falling incentives in many capital cities over recent quarters are contributing to strong effective rent growth across most CBDs.Net effective rent growth remains historically strong, with annual growth rates above the 10-year average in all cities except Perth. •Rent growth across most capital cities continues to be driven by the highest quality and best located buildings. However, notablyin the Sydney CBD we are seeing rental growth now expand beyond the core with all precincts except Southern experiencingannual net effective rent growth above 6%. It is expected that over the coming quarters, other CBDs will similarly see rentalgrowthbegin to broaden beyond the core p