The Flow Show:无衰退、无降息、无加息、无回调,无空头
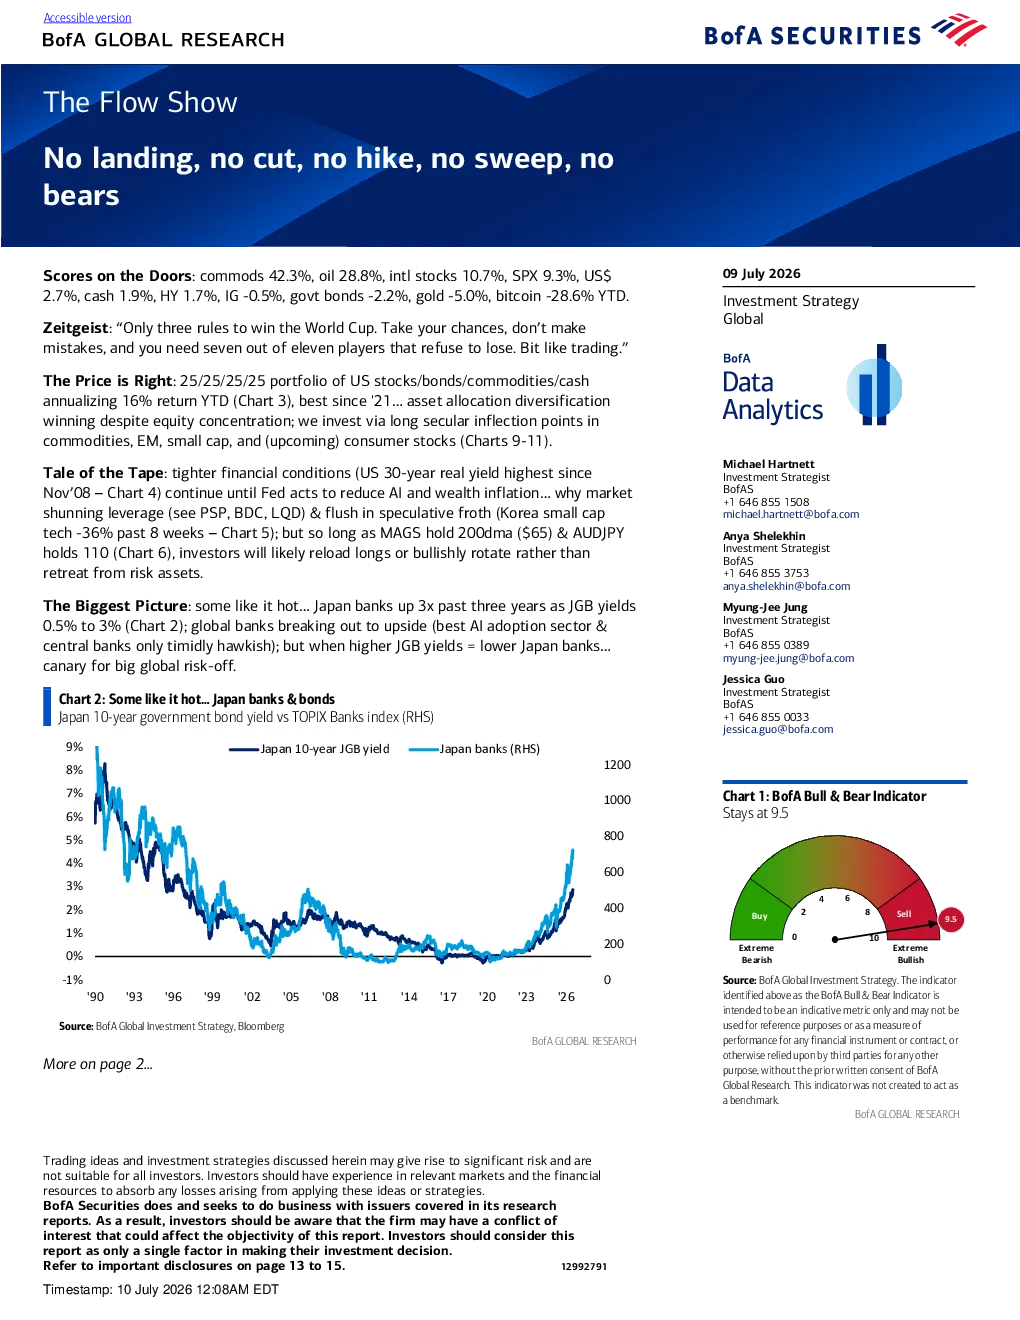
No landing, no cut, no hike, no sweep, nobears 09 July 2026 Scores on the Doors: commods 42.3%, oil 28.8%, intl stocks 10.7%, SPX 9.3%, US$2.7%, cash 1.9%, HY 1.7%, IG -0.5%, govt bonds -2.2%, gold -5.0%, bitcoin -28.6% YTD. Investment StrategyGlobal Zeitgeist:“Only three rules to win the World Cup. Take your chances, don’t makemistakes, and you need seven out of eleven players that refuse to lose. Bit like trading.” The Price is Right: 25/25/25/25 portfolio of US stocks/bonds/commodities/cashannualizing 16% return YTD (Chart 3), best since '21…asset allocation diversificationwinning despite equity concentration; we invest via long secular inflection points incommodities, EM, small cap, and (upcoming) consumer stocks (Charts 9-11). Michael HartnettInvestment StrategistBofAS+1 646 855 1508michael.hartnett@bofa.com Tale of the Tape: tighter financial conditions (US 30-year real yield highest sinceNov’08–Chart 4) continue until Fed acts to reduce AI and wealth inflation…why marketshunning leverage (see PSP, BDC, LQD) & flush in speculative froth (Korea small captech -36% past 8 weeks–Chart 5); but so long as MAGS hold 200dma ($65) & AUDJPYholds 110 (Chart 6), investors will likely reload longs or bullishly rotate rather thanretreat from risk assets. Anya ShelekhinInvestment StrategistBofAS+1 646 855 3753anya.shelekhin@bofa.com The Biggest Picture: some like it hot…Japan banks up 3x past three years as JGB yields0.5% to 3% (Chart 2); global banks breaking out to upside (best AI adoption sector ¢ral banks only timidly hawkish); but when higher JGB yields = lower Japan banks…canary for big global risk-off. Myung-Jee JungInvestment StrategistBofAS+1 646 855 0389myung-jee.jung@bofa.com Jessica GuoInvestment StrategistBofAS+1 646 855 0033jessica.guo@bofa.com Chart2:Some like it hot… Japan banks & bondsJapan 10-year government bond yield vsTOPIX Banks index(RHS) Source:BofA Global Investment Strategy. The indicatoridentified above as the BofA Bull & Bear Indicator isintended to be an indicative metric only and may not beused for reference purposes or as a measure ofperformance for any financial instrument or contract, orotherwise relied upon by third parties for any otherpurpose, without the prior written consent of BofAGlobal Research. This indicator was not created to act asa benchmark.BofA GLOBAL RESEARCH More on page 2… Trading ideas and investment strategies discussed herein may give rise to significant risk and arenot suitable for all investors. Investors should haveexperience in relevant markets and the financialresources to absorb any losses arising from applying these ideas or strategies.BofA Securities does and seeks to do business with issuers covered in its researchreports. As a result, investors should be aware that the firm may have a conflict ofinterest that could affect the objectivity of this report. Investors should consider thisreport as only a single factor in making their investment decision.Refer to important disclosures on page 13 to 15.12992791 Timestamp: 10 July 2026 12:08AM EDT Weekly Flows: $56.4bn to stocks, $39.5bn to cash, $31.3bn to bonds, $0.5bn to crypto,$0.3bn to gold. Flows to Know: •Cash: $39.5bn inflow…Money Market Fund assets at new $7.9tn all-time high(Chart 7),•IG bonds: $16.0bn inflow…14thweek of inflow,•Bank loans: $1.5bn inflow…largest since Feb’25,•Equities: $56.4bn inflow…4thlargest YTD (Chart 16),•China equities: $9.0bn inflow…largest since Dec’25 (Chart 13),•Financials: $2.4bn inflow…largest since Jan’26 (Chart 14),•Tech: $18.8bn inflow…tech on track for record $183bn inflow in’26 (Chart 15). BofA Private Clients: $4.6tn AUM…65.7% stocks, 17.3% bonds, 9.7% cash; privateclient equity ETF share count up 5.7% YTD, 0.6% past 4 weeks, 0.3% past week (up 24out of 27 weeks YTD); past 4 weeks, private clients buying muni bond & defensive sectorETFs (healthcare, utilities), selling ETF commodity exposure (MLP, energy, preciousmetals). BofA Bull & Bear Indicator1: stays at extreme bull reading of 9.5 as strong equity andtech inflows + lower HY and AT1 bond spreads are offset by weaker global stock indexbreadth; "sell signal" triggered May…past 24 years 17“sell signals,”average loss ACWIover 2-3 months is 2-3%, hit ratio ~60%, max drawdowns 15-20% (seeBofA Bull & BearIndicatorreport); extreme bull positioning says reduce risk exposure. The“no”consensus…no landing, no Fed hike, no AI capex cut, no DEM sweep inmidterms…why no H2 bears… •“No landing”…no H2 slowdown in economy = nominal boom continues =“AnythingBut Bonds" allocation…“can’t buy bonds, can’t sell stocks”,•“No Fed hike”at least before midterms as hike not good for asset prices and macroahead of midterms = risk bullish as Fed & global central banks timidly hawkish…central bank rate cuts (34) in‘26 outpacing hikes (21–Chart 8),•“No cut”in hyperscaler AI capex…consensus forecast ~$800bn in '26 and ~$1tn in'27,•“No sweep”by DEMs in US midterms…rated 1/4 likelihood by global investors inBofA June FMS