黄金ETF流量:2026年6月
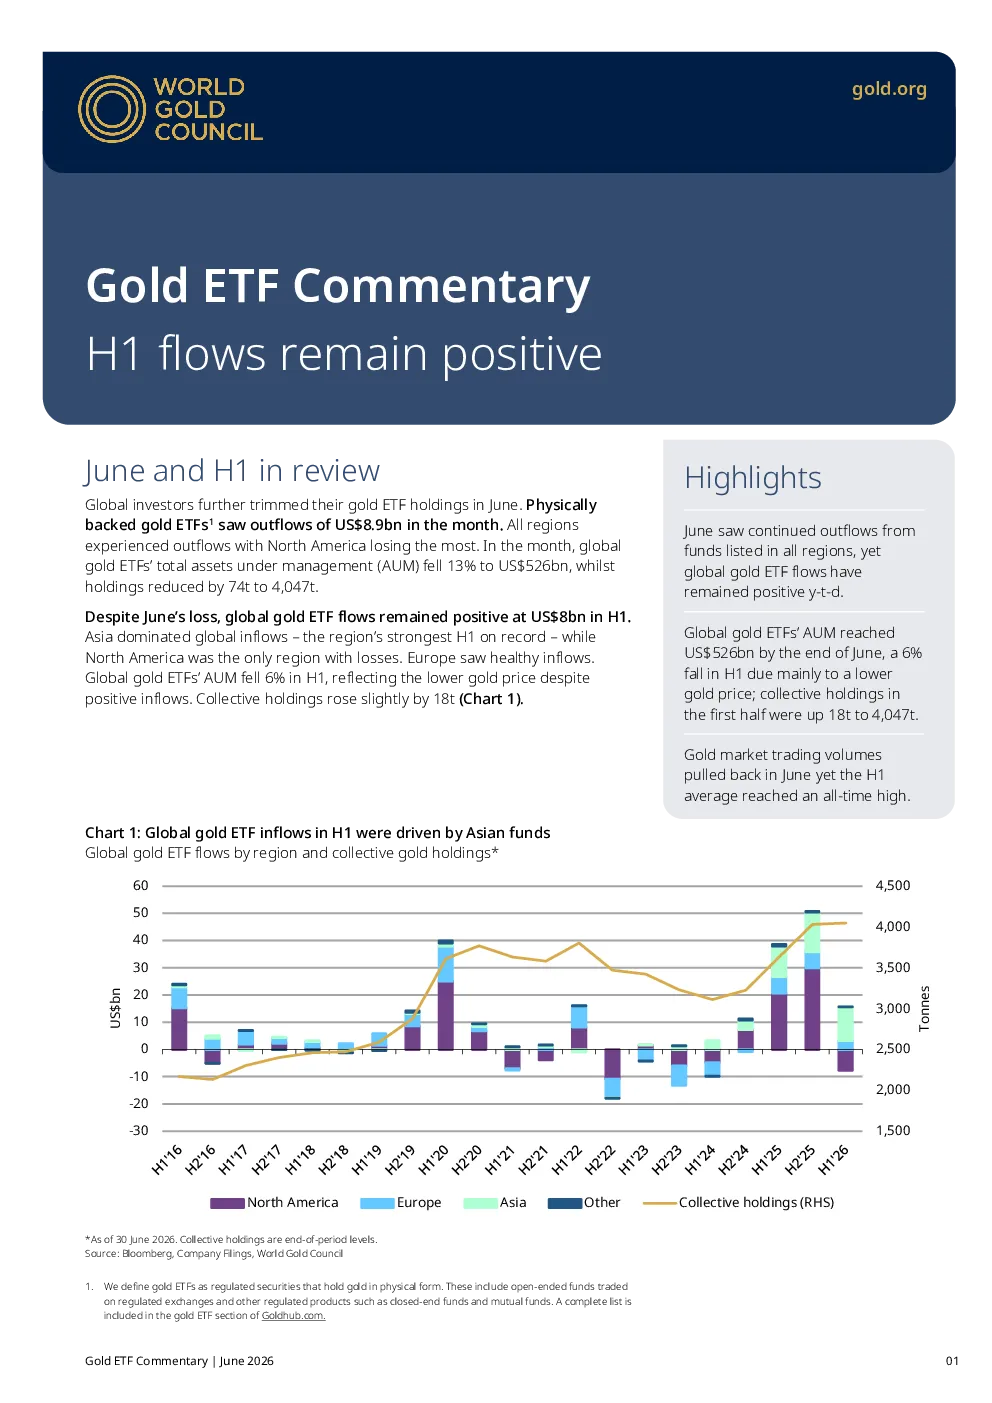
六月及H1回顾 亮点 全球投资者在6月份进一步减持了其黄金ETF头寸。实物支持的黄金ETF¹当月流出89亿美元。所有地区均出现资金流出,北美地区流出额最大。当月,全球黄金ETF管理的总资产(AUM)下降了13%,至5260亿美元,而持有量减少了74吨,至4047吨。 6月份,全球各地区的基金持续出现资金流出,但截至本年度迄今为止,全球黄金ETF的资金流入仍保持正值。 尽管6月黄金价格下跌,但上半年全球黄金ETF资金流入仍保持正值,达80亿美元。亚洲主导全球资金流入——该地区创下了有记录以来上半年最强劲的流入——而北美是唯一出现资金净流出的地区。欧洲则观察到健康的资金流入。上半年全球黄金ETF的总资产规模下降了6%,这反映了尽管资金流入为正,但金价较低。整体持有量略有上升,增加了18公吨(图表)。 截至6月底,全球黄金ETF的资产管理规模达到5260亿美元,上半年下跌6%,主要原因是金价走低;上半年集体持仓增加180吨,达到4047吨。 6月份黄金市场交易量有所回落,但上半年平均水平达到了历史最高点。 欧洲基金六月损失8.18亿美元,将上半年流入额削减至32亿美元。六月期间,该地区主要市场均出现资金流出。我们相信,该地区黄金价格疲软是导致投资者净卖出黄金ETF的主要因素。此外,六月欧洲央行加息25个基点,这是自2023年9月以来的首次,因应美伊冲突持续的通胀担忧。此举可能已阻止部分投资者投资黄金。我们还观察到该地区计价货币对美元贬值的瑞士等地,外汇对冲产品持续出现资金流出,进一步加剧了欧洲基金六月的损失。 区域概览 北美基金六月损失55亿美元,使该地区H1的资金净流出额达到77亿美元,创下自2013年以来最差上半年表现。当月显著的金价回调成为投资者削减黄金ETF配置的关键动因。随着新任美联储主席沃什发出市场解读为鹰派的信号,以及美伊冲突加剧通胀担忧,市场预期未来利率将上升。这种预期推动了实际收益率上升和美元走强,从而增加了投资者持有黄金的机会成本。 亚洲6月份出现了23亿美元的资金净流出,创下纪录中最差月份。尽管如此,该地区经历了有史以来最强的上半年,以120亿美元的增加额引领全球资金流入。6月份的损失主要来自中国资金,由于股市上涨和金价走弱,当地投资者的风险偏好持续改善。日本资金也在此月出现流出,因为日本央行加息,推高了当地投资者持有黄金的机会成本。印度则逆势吸引资金流入,因为当地投资者对金价保持乐观,并将下跌视为入市机会。 展望未来,区域黄金ETF的资金流向可能趋于稳定。我们在《2026年中期黄金展望》中的宏观共识情景表明,下半年黄金表现相对稳定,而潜在的催化剂在其他情景下可能酝酿着突破。与此同时,地缘政治、经济增长和金融市场周围的不确定性仍然存在。这一背景可能会继续支持投资者对投资组合保护的需求,并维持对黄金ETF作为战略性安全避风港配置的兴趣。 其他地区的资金在6月份出现了2.62亿美元的温和流出,使其年初至今的买入额降至1.06亿美元。6月份,澳大利亚基金减少了1.97亿美元,南非基金损失了3600万美元。 尽管金价走弱,COMEX净多头总量的环比增长了16%,达到538公吨,为自1月以来的最高月末水平。值得注意的是,尽管金价走弱,自6月初以来,管理型资金净多头一直在增加。对CFTC持仓数据的更仔细分析揭示了不同投资者群体之间的分化:虽然非报告净多头——作为散户参与度的指标——在本月有所减少,但其他报告类持仓,即管理型资金类别之外的大额交易,环比增长了16%。 史无前例的H1 全球黄金市场交易量6月有所放缓,环比下降13%,日均交易量平均为3730亿美元,随着场外(OTC)和交易所市场的活动降温。场外交易活动下降13%,日均交易量为2140亿美元,尽管仍远高于2025年日均1800亿美元的平均水平。LBMA的交易所交易量6月平均为1870亿美元/天,环比下降14%,但较2025年平均水平高16%。与此同时,交易所交易合约量环比下降13%,日均交易量为1530亿美元。值得注意的是黄金ETF市场,其交易活动环比增长23%,日均交易量达到69亿美元,反映出投资者持续的兴趣。 截至H1,管理资金净多头头寸总体保持稳定,仅较年初减少430万。H1期间,投资者行为有所不同:散户的仓位主要跟随短期价格走势,而大额交易者的头寸自3月中旬以来总体保持稳定。 全球黄金市场流动性在上半年飙升至创纪录水平,日均达4880亿美元;这是我们数据系列中表现最强的半年平均值(图表2)。市场表现全面强劲,各主要板块均创下有记录以来最活跃的半年平均值。场外交易(OTC)交易量在LBMA的引领下,平均达到2490亿美元/天,远超2025年水平,凸显了机构参与的深度。交易所交易量也大幅增长,达到2270亿美元/天——比2025年平均值高出22%——这得益于投资者活跃度提升。与此同时,全球黄金ETF交易量平均达到120亿美元/天——较2025年增长73%——主要由美国基金强劲的交易推动,随着宏观经济和地缘政治不确定性加剧,投资者日益转向黄金。 世界黄金协会 研究 我们是一个致力于倡导黄金作为战略资产作用、塑造负责任且易于获取的黄金供应链未来的会员组织。我们的专家团队通过可信的研究、分析、评论和见解,建立对黄金用例和可能性的理解。 杰里米·德佩西梅耶,CFA资产配置策略师 约翰·帕尔姆贝格资深量化分析师 卡维塔·查科,首席研究员,印度 克里希安·戈帕尔(Krishan Gopaul),资深分析师,欧洲、中东和非洲区 路易斯街高级市场分析师 我们推动行业进步,塑造政策,并为一个永久且可持续的黄金市场设定标准。 通讯作者 玛瑞莎·萨利姆 大中华区首席研究官 贾瑞 (Jiǎ Ruì),研究主管(亚太区,曾负责印度),贸易合作副主管(中国) 泰勒·伯内特,美洲研究主管 贾瑞 (Jiǎ Ruì),首席研究官(亚太区,曾任印度区),贸易合作副主管(中国)世界黄金协会 胡安·卡洛斯·阿蒂加斯,美洲区区域首席执行官,全球研究主管 市场策略 约翰·里德(资深)——欧洲及亚太区市场策略师 约瑟夫·卡瓦托尼,美洲区高级市场策略师 更多信息: 数据集和方法论访问:www.gold.org/goldhub Contact:research@gold.org 重要信息与免责声明 黄金委员会或其附属机构。© 2026 世界黄金协会。版权所有。世界黄金协会和圆圈标志是世界黄金协会的商标。 未经世界黄金协会或适当的版权所有者事先书面同意,禁止复制或重新分发本信息中的任何内容,下文另有具体规定者除外。本信息及统计数据为世界黄金协会或其关联公司或本文件中指明的第三方提供者的版权©和/或其他知识产权。各自所有者的所有权利均予保留。 根据公平行业惯例,允许出于审查和评论(包括媒体评论)之目的使用本信息中的统计数据,但须满足以下两个前提条件:(i) 仅使用有限的数据或分析片段;(ii) 对这些统计数据的任何及所有使用均需注明世界黄金协会(World Gold Council)出处,并在适当时注明 metals focus 或其他已确认版权所有者作为其来源。世界黄金协会隶属于 metals focus。 世界黄金协会及其附属机构不对任何信息的准确性或完整性作出保证,亦不承担因使用该信息而直接或间接导致的任何损失或损害的责任。 本信息仅用于教育目的,通过接收本信息,您即表示同意其预期用途。本信息中任何内容均不构成投资建议、黄金买卖、任何黄金相关产品或服务或任何其他产品、服务、证券或金融工具(统称“服务”)的购买或出售要约。本信息未考虑任何特定个人的投资目标、财务状况或特殊需求。 多元化投资并不能保证任何投资回报,亦不能消除损失风险。过往业绩并不必然预示未来结果。通过投资黄金可能产生的任何投资结果的最终表现属于假设性质,可能无法反映实际投资结果,亦非对未来结果的保证。世界黄金协会及其附属机构不对任何假设投资组合中使用的任何计算和模型,或由此产生的任何结果提供担保或保证。投资者应在就任何服务或投资做出任何决定前,与其相应的投资专业人士讨论其个人情况。 本信息可能包含前瞻性陈述,例如使用“相信”、“预期”、“可能”或“表明”等词语或类似术语的陈述,这些陈述基于当前预期并可能发生变化。前瞻性陈述涉及诸多风险和不确定性。无法保证任何前瞻性陈述将得以实现。世界黄金协会及其附属公司不承担更新任何前瞻性陈述的责任。 关于LBMA黄金价格的资讯 伦敦贵金属市场协会(LBMA)黄金价格由 ICE Benchmark Administration Limited(IBA)管理和发布。LBMA 黄金价格是贵金属价格有限公司的注册商标,IBA 作为 LBMA 黄金价格的运营机构获得授权。ICE 和 ICE Benchmark Administration 是 IBA 及其附属公司的注册商标。经 IBA 授权,世界黄金协会使用 LBMA 黄金价格,并受本协议项下规定的限制(http://www.gold.org/terms-and-conditions)。 请注意,通过使用Quarium、黄金估值框架和其他信息所生成的各种投资结果的预期表现属于假设性质,可能无法反映实际投资结果,也不构成对未来结果的保证。世界黄金理事会(包括其附属机构)或牛津经济学院对工具的功能性不作任何保证或担保,包括但不限于任何预测、估计或计算。