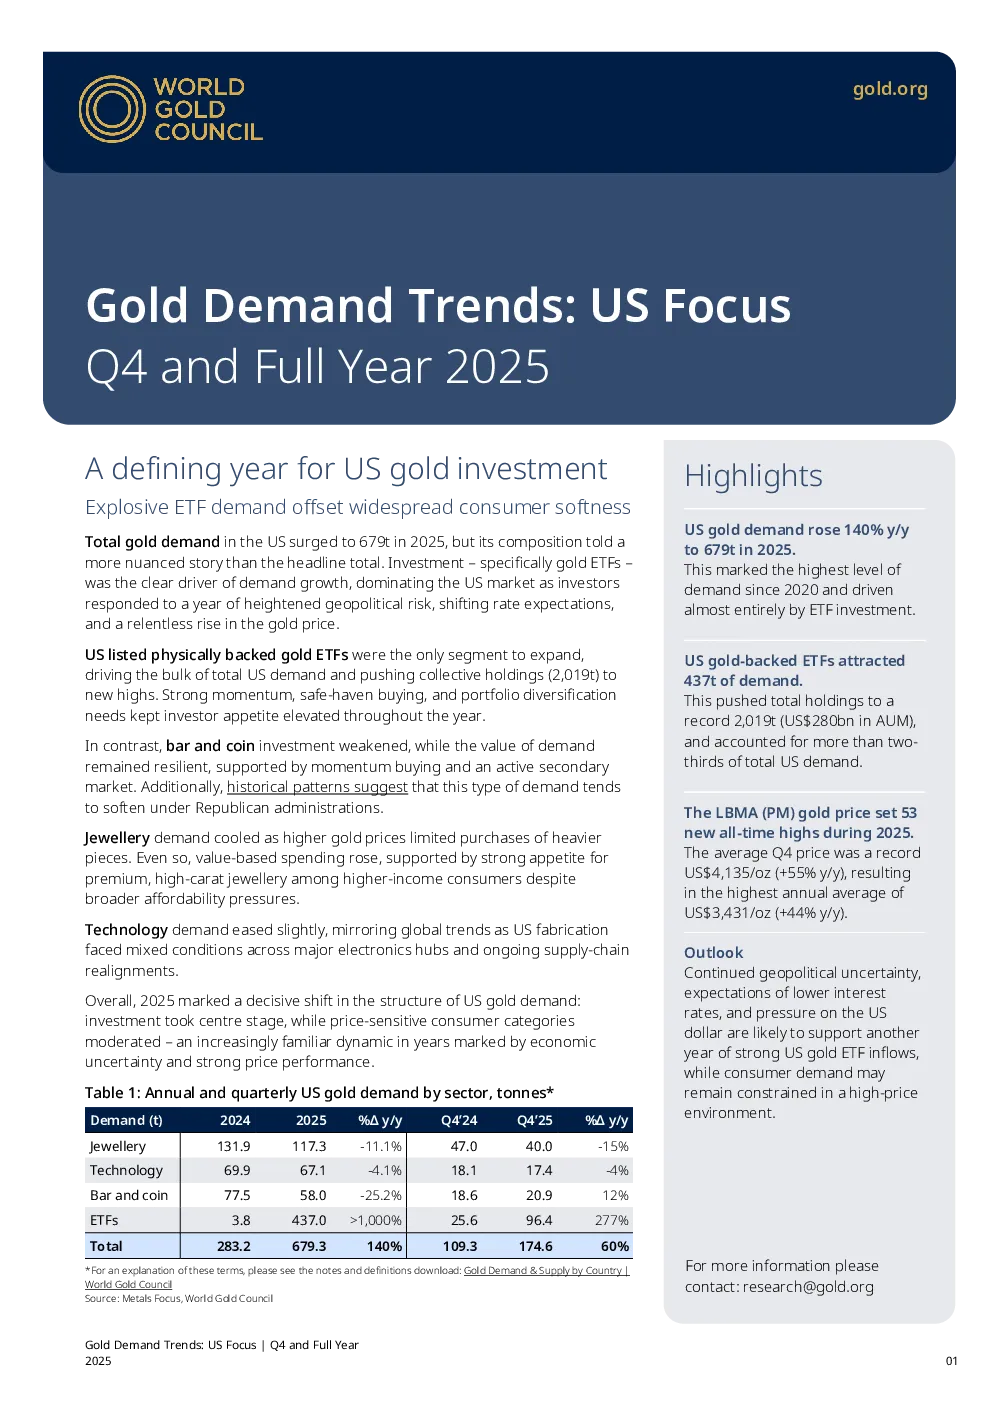
Gold Demand Trends: US FocusQ4 and Full Year 2025 A defining year for US gold investment Highlights Explosive ETF demand offset widespread consumer softness US gold demand rose140% y/yto 679t in 2025.Thismarked the highest level ofdemand since 2020 and drivenalmost entirely by ETF investment. Total gold demandin the US surged to 679t in 2025, but its composition told amore nuanced story than the headline total. Investment – specifically gold ETFs –was the clear driver of demand growth, dominating the US market as investorsresponded to a year of heightened geopolitical risk, shifting rate expectations,and a relentless rise in the gold price. US listed physically backed gold ETFswere the only segment to expand,driving the bulk of total US demand and pushing collective holdings (2,019t) tonew highs. Strong momentum, safe-haven buying, and portfolio diversificationneeds kept investor appetite elevated throughout the year. US gold-backed ETFs attracted437t of demand. This pushedtotal holdings to arecord 2,019t (US$280bn in AUM),and accounted for more than two-thirds of total US demand. In contrast,bar and coininvestment weakened, while the value of demandremained resilient, supported by momentum buying and an active secondarymarket. Additionally,historical patterns suggestthat this type of demand tendsto soften under Republican administrations. The LBMA (PM) gold price set 53new all-time highs during 2025.The average Q4 price was a recordUS$4,135/oz (+55% y/y), resultingin the highest annual average ofUS$3,431/oz (+44% y/y). Jewellerydemand cooled as higher gold prices limited purchases of heavierpieces. Even so, value‑based spending rose, supported by strong appetite forpremium, high‑carat jewellery among higher‑income consumers despitebroader affordability pressures. Technologydemand eased slightly, mirroring global trends as US fabricationfaced mixed conditions across major electronics hubs and ongoing supply‑chainrealignments. Outlook Continued geopolitical uncertainty,expectations of lower interestrates, and pressure on the USdollar are likely to support anotheryear of strong US gold ETF inflows,while consumer demand mayremain constrained in a high‑priceenvironment. Overall, 2025 marked a decisive shift in the structure of US gold demand:investment took centrestage, while price‑sensitive consumer categoriesmoderated – an increasingly familiar dynamic in years marked by economicuncertainty and strong price performance. For more information pleasecontact:research@gold.org At the macro level, intensifying geopolitical andgeoeconomic tensions, combined with a weaker US dollarand modestly lower interest rates, prompted investors toseek both safe‑haven assets and portfolio diversification. ETF momentum saves US gold demand A rallying gold price marked by 53 record highs1helpedcreate a reinforcing demand feedback loop in which ETFinvestment rose alongside the underlying gold price. As aresult,gold ETFs played an outsized role, accounting forroughly two-thirds of both quarterly and annual demand(Chart2). This backdrop supported gold investment globally, wherephysically-backed gold ETFs recorded theirstrongest year ofinflowson record (US$89bn) and the second‑highest annualdemand ever (801t). The US was the key engine of this surge:US-listed ETFs attracted US$50bn of inflows and 437t ofdemand, representing more than half of global totals. While the higher gold price undoubtedly supportedinvestment inflows, the primary factors that drive gold wereunusually balanced during the year.2 Note that US funds also recorded their strongest year ofinflows(Chart3). Chart2:GoldETFsaren’talways the demand driver…butthey are now Percentage breakdown of quarterlyand annual demand* Annual net cumulative flows broken out by month* In addition,gold remains under‑allocated within the broaderinvestment universe. As a rough proxy, comparing themarket share of gold-backed ETFs to total ETF assets showsthat – even with 2025’s increase – gold’s share remainsbelow its 2020 level and well under its peak during the GFC(Chart5). In tonnage terms, demand recorded its second strongestyear on record(Chart4). Chart4:Net demand surpasses 2009 levels Annual net cumulative demand (t) broken out by month* Key US funds snapshot Table 2: Top four US listed funds based on net inflows The three strongest years for both gold ETF fund flows anddemand have occurred during periods of significant globalstress: the Global Financial Crisis (GFC), the COVID-19pandemic (2020), and the heightened geopoliticaluncertainty of 2025. However, periods of risk do not always align neatly withcalendar years, andcumulative ETF holdings still sit belowlevels reached during previous episodes of heighteneduncertainty. North America retail investment Below are key takeaways from recent conversations withNorth American dealers on current market trends: •Retailers describe the environment as “COVID-esque,”marked by overwhelming order volumes, cons