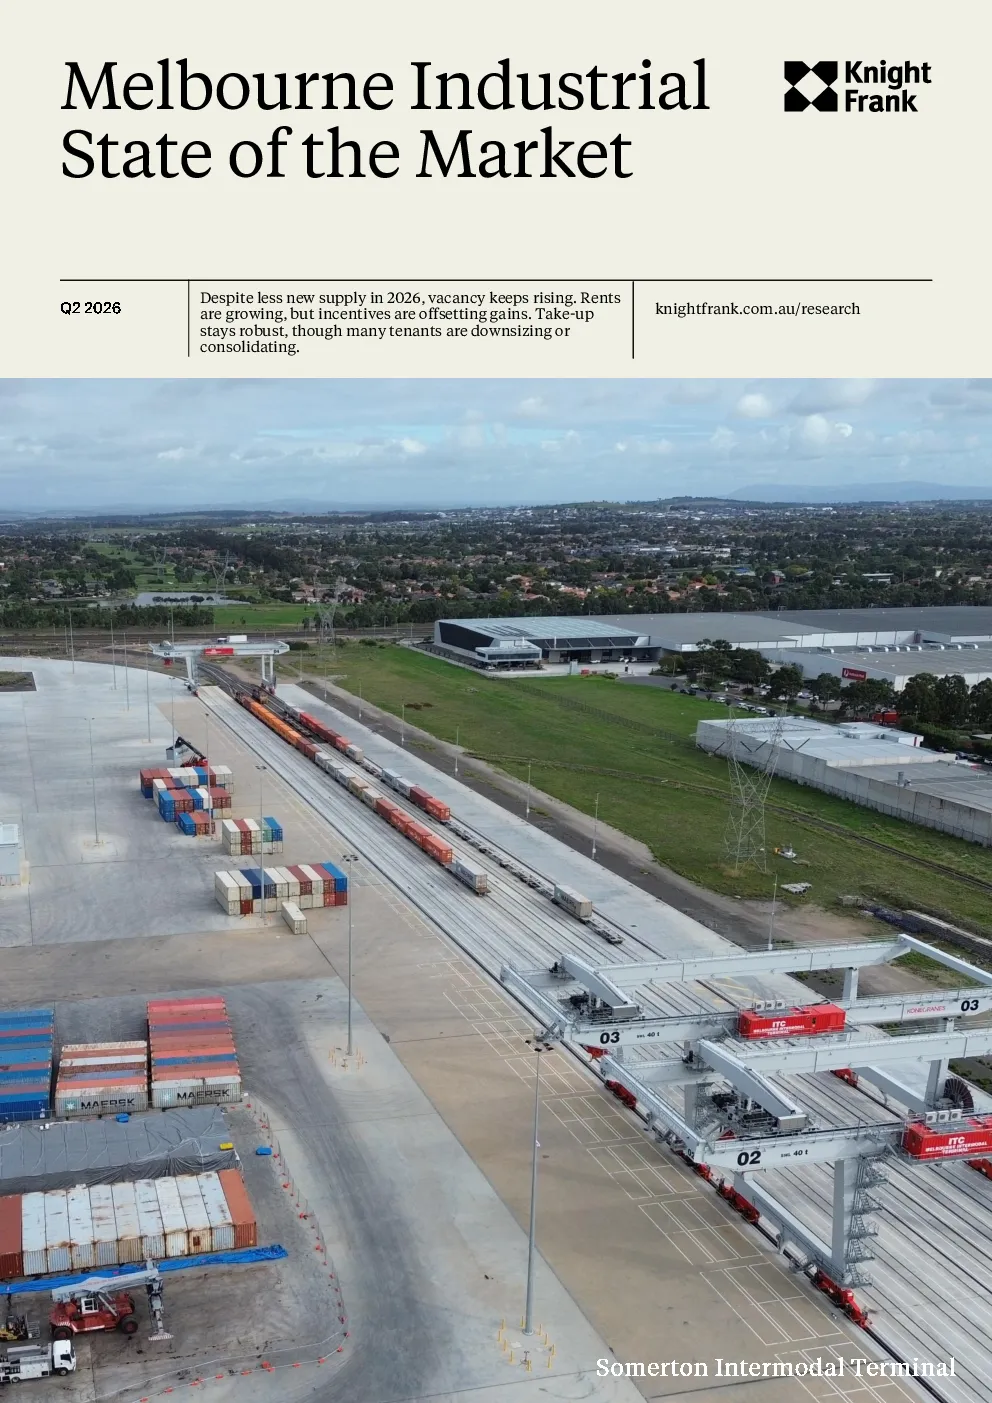
墨尔本工业市场状况2026年第二季度
租赁概览 尽管需求强劲,空置率仍被推高至5.0%。 • 主要净租金面积同比上涨1.0%,环比上涨5.6%,所有区域平均为每平方米155美元。 • 2026年上半年吸纳量保持强劲,达到72.3万平方米,较10年平均水平有所领先。 • 工业市场空置率已达到5.0%,随着吸纳量的增加,市场正在整合。 • 新增供应量从2025年下降37%,至2026年的53万平方米,其中33%于2026年上半年完成。 投资概览 墨尔本连续第二季度主要收益出现回落。 • 主要工业区的收益率较2026年第二季度进一步下降了15个基点,在墨尔本平均为6.0%。 • 主要仓储物业的资本价值平均为每平方米2,581美元,环比下降1.5%,同比下降1.7%。 • 小型和中等地块的 land value 保持稳定,在过去3年中增长不到5.0%。 • 墨尔本的投资额依然低迷,截至本年度仅录得44笔交易。 北 北方职位空缺持续激增,目前达到7.7%。 7.7% 93k Take-up Q2-2026-25.5% q/q Vacancy rateLast QTR = 6.4%Q2-2025 = 4.3% 21.7% $145/sqm Prime net face rent+1.2% q/q+3.0% y/y 上一季度主要激励为21.7%,2025年第二季度为19.2%。 6.25% 66k Prime yield+13 bps q/q+42 bps y/y 2026年新供应预测 +42.1万平方米,2027年 +42.1万平方米 关键趋势 • 北区核心网面租金在过去一年中温和增长,上涨3.0%,平均达到每平方米145美元。 • 激励措施同比(q/q)持平,但同比(y/y)上涨了2.5%,平均达到21.7%,使得有效租金同比(y/y)维持在每平方米114美元。 • 随着亚马逊克雷吉本配送中心的延期12个月,北区的供应量预计将在2027年达到创纪录的42.1万平方米。 • 这意味着2026年新增供应量将降至2019年以来的最低水平,预计年底仅达66,000平方米。 计划于2027年在4-Ten Epping、MIIX Estate和Somerton Logistics Estate进行投机性仓储。 • 2026年第二季度职位空缺再次上升,环比增长1.3%,达到7.7%,显著高于其他任何区域,领先西部地区(5.7%)。 West 新的供应预计将持续疲软,直至2028年。 西区工业租金及补贴 5.7% 167k Take-up Q2-2026-20.6% q/q Vacancy rateLast QTR = 5.3%Q2-2025 = 3.3% 26.1% $141/sqm Prime net face rent+0.8% q/q+2.8% y/y 主要激励措施上季度为26.1%,2025年第二季度为25.3% 6.13% 222k Prime yield+13 bps q/q+30 bps y/y 2026年新供应预测 +226,000平方米,2027年 + 226,000平方米 关键趋势 西方的租金增长较为温和,环比上涨0.8%,同比增长2.9%,平均租金达到每平方米141美元。 • 主要激励措施保持稳定但处于高位,季度环比为26.1%,尽管租赁数据显示,在部分郊区,激励措施高达30.0-32.5%。 • 过去一年,职位空缺率持续上升,从3.3%升至5.7%,目前已远超10年平均水平3.1%。 • 尽管空置率上升,但吸纳量依然强劲,过去一年达到61.9万平方米,2026年第二季度达到16.6万平方米,这得益于租户整合资源并利用仓储空间增加立方容量所带来的支撑。 • 预计2026年新增供应量为22万平方米,2027年为22.6万平方米,远低于414万平方米的10年平均水平。 • 主要工业收益率平均为6.13%,较2026年第二季度下降125个基点,较去年同期下降300个基点。 东南 强劲的租金增长在很大程度上被不断上涨的佣金所抵消 东南地区工业租金及优惠政策 4.1% 93k 按等级划分,单位面积净售价/平方米(左侧),以及奖励百分比(右侧) Take-up Q2-2026+320.6% q/q Vacancy rateLast QTR = 3.7%Q2-2025 = 1.8% 23.3% $156/sqm Prime net face rent+3.3% q/q+9.4% y/y 主要激励措施上季度为19.6%,2025年第二季度为16.9%。 6.00% 200k Prime yield+13 bps q/q+50 bps y/y 2026年新供应预测 +10.3万平方米,2027年 + 10.3万平方米 关键趋势 • 在墨尔本所有工业区中,东南部地区经历了最强劲的租金增长,过去一年租金上涨了9.4%,平均达到每平方米156美元。 • 这部分增长在很大程度上被更高的激励措施所抵消,目前主要资产的平均激励已达到23.3%,较去年同期16.9%增长了6.4%。 • 过去两年,职位空缺率显著上升,目前平均为4.1%,远高于10年平均值1.8%。 • 历史上,东南部地区的激励措施和空置率一直最低,但包括帕肯汉姆(Pakenham)和克拉本纳韦斯特(Cranbourne West)在内的发展郊区的新增供应浪潮,加上需求疲软,已扰乱了市场。 2026年第二季度,ESR在帕肯汉的企业产业园完成了投机性仓库的建设,向市场新增了3.9万平方米。 预计2026年新增供应将有所放缓,预计为20万平方米,较2025年的36.6万平方米有所下降。 East 其唯一低于十年空置率平均值的区域 2.0% 5k Take-up Q2-2026Last QTR = 0ksqm Vacancy rateLast QTR = 2.4%Q2-2025 = 1.3% 22.5% $143/sqm Prime net face rent+0.0% q/q+7.5% y/y 主要激励 - 去年第四季度 = 22.5% 2025年第二季度 = 18.8% 6.00% 41k Prime yield+25 bps q/q+50 bps y/y 2026年新供应预测+ 50,000平方米,2027年 关键趋势 • 主要净租金收入在强劲的年度增长后暂停,同比(年增长率)增长7.5%(环比持平),平均达到每平方米143美元。 • 虽然租金增长强劲,但大部分已被不断攀升的激励措施所抵消,后者在过去一年中从18.8%上涨至22.5%。因此,净有效租金仅上涨2.6%,平均为每平方米110美元。 来源:Knight Frank 研究 • 东区是墨尔本唯一一个空置率低于其十年平均水平的区域,目前空置率为2.0%,而长期平均水平为2.7%。 • 该区域历史上新增供应有限,尽管目前有三处开发项目正在建设中:山景公路物流枢纽、基尔希尔连接项目以及888山景公路。 • 主要工业地产回报率随墨尔本各片区普遍下调,东部地区平均为6.00%,环比下降13个基点,同比下降50个基点。 数据摘要 一级品:现代设计、状况良好且用途广泛,包含办公部分5-30%。坐落于成熟的工业区。良好的通道。 二级品:设计较旧,状况良好/不佳,次于头等品,办公组件占比在10-20%之间。 空置率分析方法:此项分析收集并整理了墨尔本工业地产市场中所有工业物业(面积≥5,000平方米)的空置数据,并将建筑分类为:1)现有建筑——可供租赁的现有建筑;2)投机性建筑——已投机性建造且已达到实用完工但仍空置的可供租赁建筑;3)投机性在建建筑——正在投机性建造且将在56个月内可供出租的可供租赁建筑。 我们欢迎提问,如果您对我们的研究有任何疑问,或者需要一些房产建议,我们非常乐意收到您的来信。 Head ofIndustrial Logistics, VICJoel Davy+61 411 109 876joel.davy@au.knightfrank.com Research & Consulting, VICTony McGough+61 406 928 820tony.mcgough@au.knightfrank.com harley.bowen@au.knightfrank.com工业投资 哈利·博恩 +61 423395 582 Research & Consulting, VICLaurence Panozzo+61 401 251 876laurence.panozzo@au.knightfrank.com Valuation & Advisory, VICMichael Schuh+61 412 443 701michael.schuh@vic.knightfrank.com.au Industrial Logistics, VICStuart Gill+61 417 322 080stuart.gill@au.knightfrank.com 重要声明 © Knight Frank Australia Pty Ltd 2026 –本报告仅用于一般信息参考,不得以任何方式依赖。尽管本报告中所呈现的信息、分析、观点和预测采用了高标准进行准备,但Knight Frank Australia Pty Ltd对因使用、依赖或参考本文件内容而产生的任何损失或损害,概不承担责任。作为一份通用报告,本材料不一定代表Knight Frank Australia Pty Ltd对特定物业或项目的观点。未经Knight Frank Australia Pty Ltd事先书面批准,禁止以任何形式复制本报告的全部或部分内容。