最好的时代最坏的时代:如何在亚洲的K型撕裂中投资
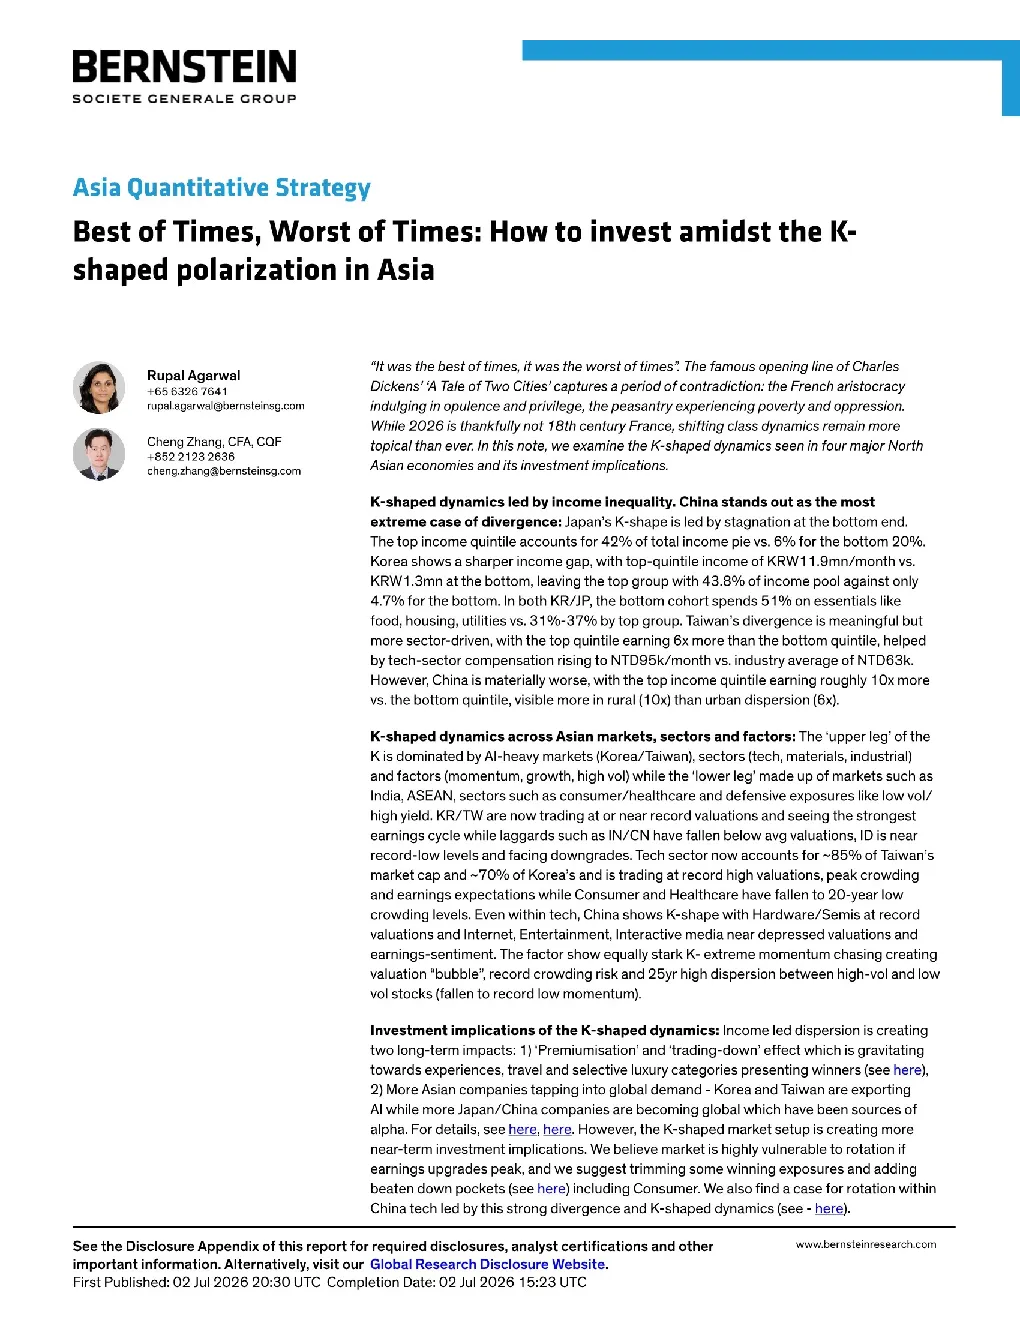
shaped polarization in Asia Dickens'A Tale of Two Cities'captures a period of contradiction:the Frencharistocracyindulging inopulenceandprivilege,thepeasantryexperiencingpovertyandoppression.While2026is thankfullynot18thcenturyFrance, shifting classdynamicsremainmoretopical than ever. In this note, we examine the K-shaped dynamics seen in four major NorthAsianeconomiesanditsinvestmentimplications.K-shaped dynamicsled by income inequality.China stands outas themost rupal.agarwal@bernsteinsg.comCheng Zhang, CFA, CQF +85221232636cheng.zhang@bernsteinsg.com extreme case of divergence: Japan's K-shape is led by stagnation at the bottom end. The top income quintile accounts for 42% of total income pie vs.6% for the bottom 20%.Korea shows a sharper income gap,with top-quintile income of KRW11.9mn/month vs.KRw1.3mn at thebottom,leaving thetopgroupwith43.8%of incomepoolagainstonly4.7%forthebottom.InbothKR/JP,thebottomcohortspends51%onessentials likefood, housing, utilities vs. 31%-37% by top group. Taiwan's divergence is meaningful butmore sector-driven, with the top quintile earning 6x more than the bottom quintile, helpedbytech-sector compensationrisingtoNTD95k/monthvs.industryaverageofNTD63k.However, China is materially worse, with the top income quintile earning roughly 1Ox morevs.the bottom quintile, visible more in rural (10x)than urban dispersion (6x). Kis dominated by Al-heavy markets (Korea/Taiwan),sectors (tech,materials,industrial)and factors (momentum, growth, high vol) while the'lower leg'made up of markets such asIndia,ASEAN,sectors suchasconsumer/healthcareanddefensiveexposureslikelowvol/high yield.KR/TW are now trading at or near record valuations and seeing the strongestearnings cycle whilelaggards such as IN/CN havefallen below avg valuations,ID is nearrecord-lowlevelsandfacingdowngrades.Techsectornowaccountsfor~85%of Taiwan'smarket cap and~70% of Korea's and is trading at record high valuations,peak crowdingand earnings expectations while Consumer and Healthcare have fallen to20-yearlowcrowding levels.Even within tech, China shows K-shape with Hardware/Semis at recordvaluationsandInternet,Entertainment,Interactivemedianeardepressedvaluationsandvaluation"bubble",recordcrowding riskand 25yr highdispersion betweenhigh-voland lowvol stocks (fallen to record low momentum). Investment implications of theK-shapeddynamics:Incomeled dispersion is creatingtwo long-term impacts: 1)"Premiumisation'and'trading-down'effect which is gravitatingtowards experiences,travel and selective luxury categories presenting winners (see here),2) More Asian companies tapping into global demand-Korea and Taiwan are exportingAl while more Japan/China companies are becoming global which have been sources ofalpha. For details, see here, here. However, the K-shaped market setup is creating morenear-term investment implications. We believe market is highly vulnerable to rotation ifearnings upgrades peak,andwe suggesttrimming some winning exposures andaddingbeaten down pockets (see here) including Consumer. We also find a case for rotation withinChina tech led by this strong divergence and K-shaped dynamics (see - here). WelookforK-shapedpatternsacross Japan,Korea, ChinaandTaiwanbasedon incomeandconsumptionpatternsacrossthe top and bottom income groups in each of these economies. The K-shaped economy is visible across all four markets, but theshape is different by country - the most stark income inequality is visible in China where all income cohorts are growing but thedisplay a mild K-shape, where top incomes remain strong and stable while bottom incomes improve only modestly-suggestingcontrolled inequality with limited but persistent divergence.Japan shows a stagnation led Kwhere the top group has grownwhile the lower group faces stagnation, resulting in a widening gap between the two sides. consumptionremainsconsistentlyhighandhasrecoveredfromthe2020dip,risingfromroughly¥374k/monthin2020to¥414k/month by2025,while bottom-quintileconsumptionhas moved onlymarginally,from roughly¥132k to141k.Income tells the same story: the top quintile is broadly stable with slight upward bias, but the bottom quintile is essentiallycontribution ofthetopvs.bottom income cohort in the overallincome and consumption expenditure makes thedivergencequite clear-thetop20% earninggroup contributesto42.2%/31.9%of thetotal income/expendituredistribution while bottom20%only has 6.1%/10.9%% in the totalpie.Moreover,the top earning group has experienced increase in both income andexpenditure share,reflecting the group'shigher impactin economy. Lowest earning group has seen income share decreasingoverthe period, whileexpenditure share increasing.Andthis income inequality has beena persistent aspect of Japan economy,which has been widening further in recent years. Theconsumption spendvaries sharplybyincomegroup-thebottom incomegrouphas larger shareofconsumption inessential categories such as food,housing,utilities whichaccountfor51% oftheirtotal spendas