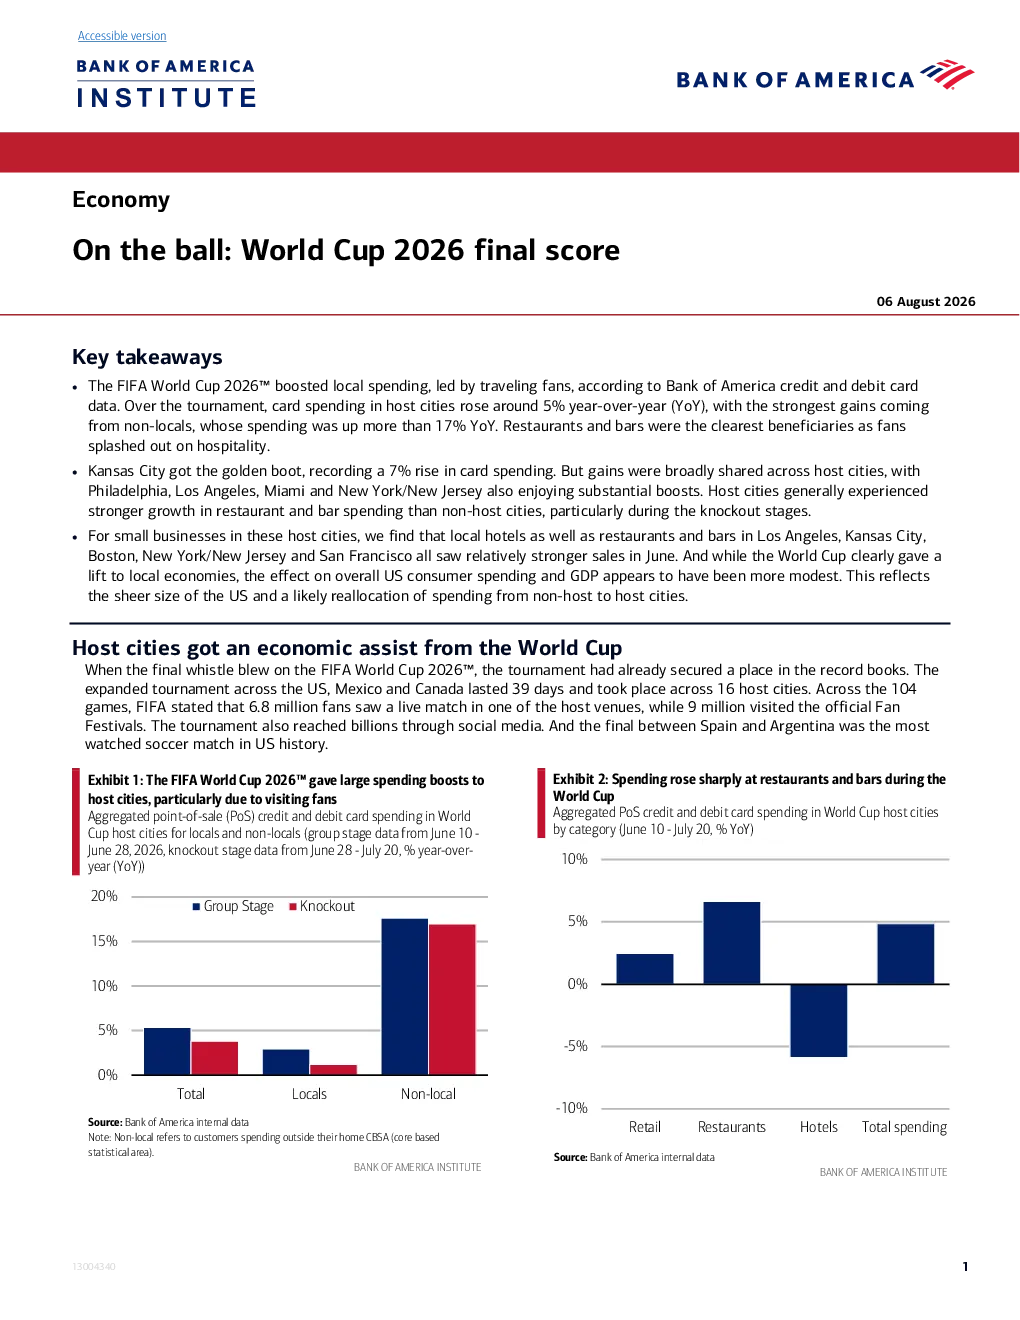
On the ball: World Cup 2026 final score 06 August 2026 Key takeaways •The FIFA World Cup 2026™boosted local spending, led by traveling fans, according to Bank of America credit and debit carddata. Over the tournament, card spending in host cities rose around 5% year-over-year (YoY), with the strongest gains comingfrom non-locals, whose spending was up more than 17% YoY. Restaurants and bars were the clearest beneficiaries as fanssplashed out on hospitality. •Kansas City got the golden boot, recording a 7% rise in card spending. But gains were broadly shared across host cities, withPhiladelphia, Los Angeles, Miami and New York/New Jersey also enjoying substantial boosts. Host cities generally experiencedstronger growth in restaurant and bar spending than non-host cities, particularly during the knockout stages. •For small businesses in these host cities, we find that local hotels as well as restaurants and bars in Los Angeles, Kansas City,Boston, New York/New Jersey and San Francisco all saw relatively stronger sales in June. And while the World Cup clearly gave alift to local economies, the effect on overall US consumer spending and GDP appears to have been more modest. This reflectsthe sheer size of the US and a likely reallocation of spending from non-host to host cities. Host cities got an economic assist from the World CupWhen the final whistle blew on the FIFA World Cup 2026™, the tournament had already secured a place in the record books. The expanded tournament across the US, Mexico and Canada lasted 39 days and took place across 16 host cities. Across the 104games, FIFA stated that 6.8 million fans saw a live match in one of the host venues, while 9 million visited the official FanFestivals. The tournament also reached billions through social media. And the final between Spain and Argentina was the mostwatched soccer match in US history. Exhibit1: The FIFA World Cup 2026™ gave large spending boosts tohost cities, particularly due to visiting fansAggregated point-of-sale (PoS) credit and debit card spending in World Exhibit2:Spending rose sharplyatrestaurantsand barsduring theWorld CupAggregated PoS credit and debit card spending in World Cup host cities by category (June 10 - July 20, % YoY) Cup host cities for locals and non-locals (group stage data from June 10 -June 28, 2026, knockout stage data from June 28 - July 20, % year-over-year (YoY)) Beyond the goals, trophies and sold-out stadiums, the World Cup also provided a useful test of how major sporting eventstranslate into local spending gains. To answer this question, we utilize Bank of America aggregated credit and debit card in-person (“point-of-sale”) spending data, which gives insight into how the spending of US households changed over thetournament. Exhibit 1shows that during the group stage of the World Cup, total card spending in host cities rose a solid 5% YoY. The boostthen eased during the knockout stage, likely due to fewer games being played. Additionally, in our view, it was probably harderfor a fan to plan where to be for those games, as they could not be sure their favorite teams would progress or where they’d beplaying. The boost to spending in host cities came primarily from“non-locals”(i.e., visitors spending outside their home city), with out-of-town spending rising more than 17% YoY. Our data captures spending by US consumer rather than overseas visitors, so itappears that the tournament did indeed encourage many Americans to travel to games, bringing their spending power to thehost cities. This is consistent with the Bank of America 2026 Summer Travel Outlook survey, which found that around 40% ofrespondents were planning on experiencing soccer over the summer (for more read our report:Summer Travel 2026: Resilient,but uneven). Which sectors topped the scoring charts?Exhibit 2shows that the biggest beneficiaries appeared to be restaurants and bars–perhaps not surprising given drinks, burgers and hotdogs often accompany spectator sports. Indeed, FIFA states that 675,000hot dogs were consumed over the tournament, along with 5.5 million beers. Perhaps more surprising in our data is that we didnot observe a boost to hotel spending over the whole tournament. In our view, this may be because people had booked and paidwell ahead of their visits. The biggest winner? Kansas CityEvery tournament has a surprise player. In spending terms, Kansas City may have been this World Cup’s standout performer, seeing around a 7% YoY increase in card spending. To some extent this probably reflects that Kansas City is a smaller city, with apopulation of 2.4 million in the metro area, so the influx of visiting fans had an outsized boost. Kansas City also had four teamsbased there–one of the few host cities with four major teams–including two that made the semis (Argentina and England).Philadelphia, Los Angeles, Miami and New York/New Jersey (NY/NJ) also all received large boosts over the tournament. It’s worth noting that some ci