您的浏览器禁用了JavaScript(一种计算机语言,用以实现您与网页的交互),请解除该禁用,或者联系我们。 [MSCI]:绘制全球市场的人工智能敞口图 - 发现报告

绘制全球市场的人工智能敞口图

信息技术 2026-07-11 - MSCI Mascower
报告封面

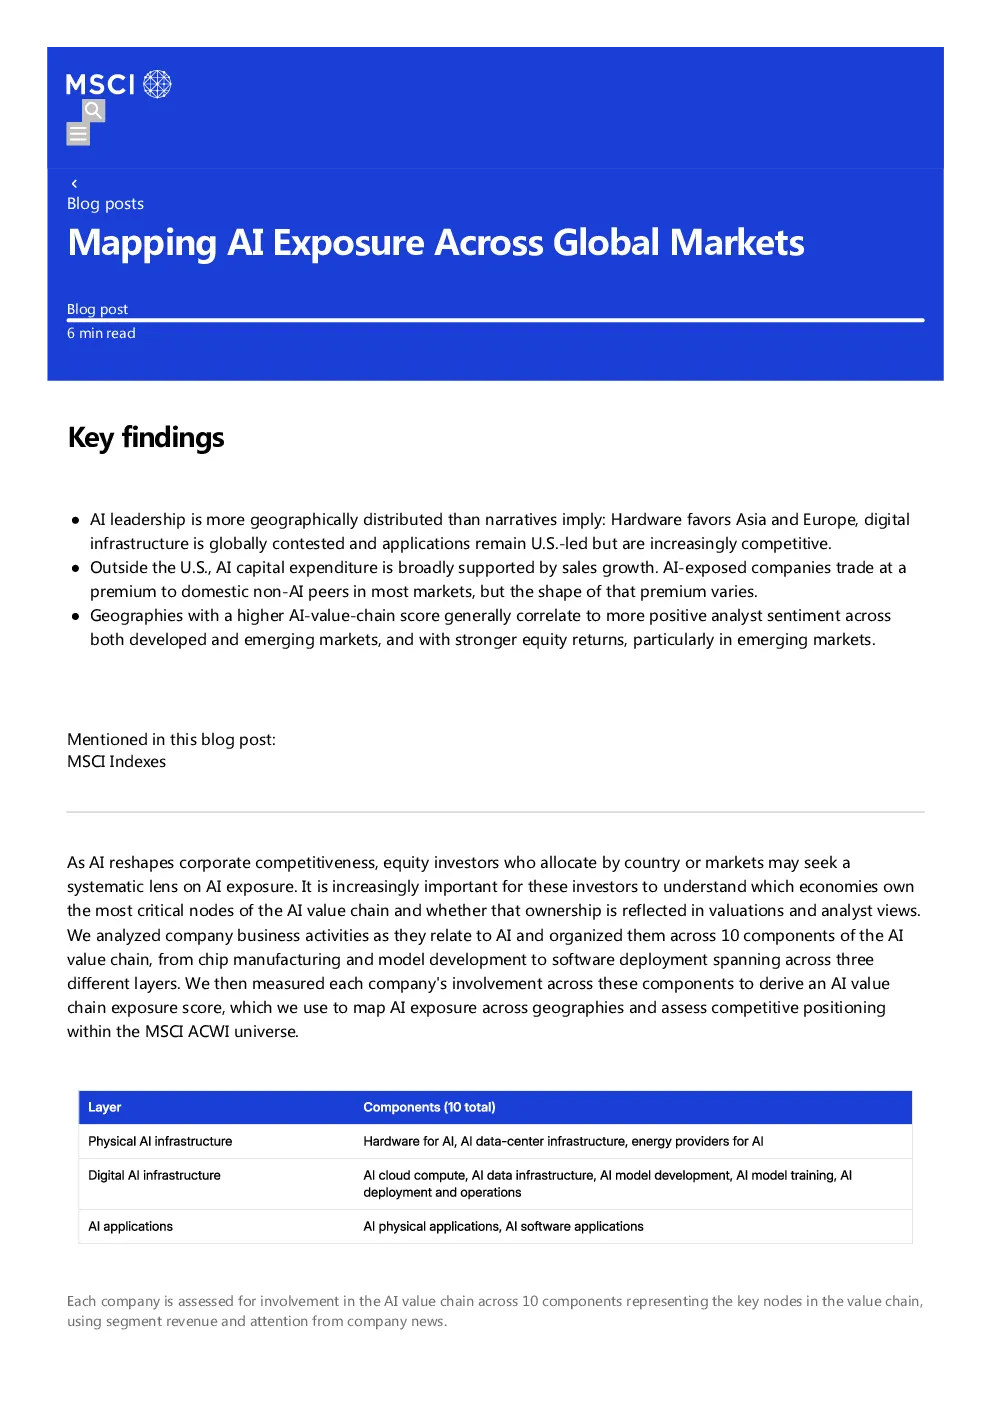
Key findings AI leadership is more geographically distributed than narratives imply: Hardware favors Asia and Europe, digitalinfrastructure is globally contested and applications remain U.S.-led but are increasingly competitive.Outside the U.S., AI capital expenditure is broadly supported by sales growth. AI-exposed companies trade at apremium to domestic non-AI peers in most markets, but the shape of that premium varies.Geographies with a higher AI-value-chain score generally correlate to more positive analyst sentiment acrossboth developed and emerging markets, and with stronger equity returns, particularly in emerging markets. Mentioned in this blog post:MSCI Indexes As AI reshapes corporate competitiveness, equity investors who allocate by country or markets may seek asystematic lens on AI exposure. It is increasingly important for these investors to understand which economies ownthe most critical nodes of the AI value chain and whether that ownership is reflected in valuations and analyst views.We analyzed company business activities as they relate to AI and organized them across 10 components of the AIvalue chain, from chip manufacturing and model development to software deployment spanning across threedifferent layers. We then measured each company's involvement across these components to derive an AI valuechain exposure score, which we use to map AI exposure across geographies and assess competitive positioningwithin the MSCI ACWI universe. Each company is assessed for involvement in the AI value chain across 10 components representing the key nodes in the value chain,using segment revenue and attention from company news. No single market owns AI; each layer has its own leaders AI exposure is spread across geographies, with Taiwan and the Netherlands leading the overall rankings by index-weighted average AI-value-chain score, ahead of the U.S. To account for the possibility that a market's high score isdriven by just a handful of firms, we also calculated a score adjusted by market concentration and the share of eachmarket's universe with meaningful AI exposure (score >= 10). Contrary to the perception that AI exposure inTaiwan, the Netherlands and Korea is dominated by a handful of companies, these areas remained in the top tieracross all three measures. Competitive advantage is distributed unevenly across the three layers of the AI value chain and the geographicrankings shift markedly across them. In the physical layer, Taiwan's foundry scale, the Netherlands' lithographytechnology and Korea's strong position in memory chips together define hardware. Data-center infrastructure drawsin the U.S., Taiwan and Ireland, reflecting the capital intensity and connectivity requirements of AI compute buildout,while energy provision adds France, Germany and the U.S., whose industrial power infrastructure has becomeincreasingly relevant as electricity demand from AI workloads grows. The digital layer is more contested: The U.S. leads in model training and China in the development of AI models, butthe two are closely matched in cloud compute. The layer draws in a notably wide range of countries: Japan, Israel,Belgium, Germany, the U.K. and the Netherlands, pointing to genuinely contested competitive positions. In AIsoftware applications, the U.S. leads, followed by China and Germany. Physical applications — spanning robotics,autonomous vehicles and industrial automation — tell a different story, with Germany and Korea emerging asstrong challengers behind the U.S. Taiwan and Netherlands lead a globally distributed AI landscape Loading chart...Please wait. Data as of May 2026. AI-value-chain score adjusted by market concentration equals index-weighted average AI Value Chain Score *(1- HHI), where HHI is the Herfindahl-Hirshman Index, a standard measure of market concentration. Fraction of universe withmeaningful AI-value-chain score is based on constituent count. Capex leads sales in the US, but the gap varies by market Investor concern about AI capital expenditure is well founded in aggregate, but a closer look reveals a morenuanced picture. The over-expenditure risk is, for now, a predominantly U.S. phenomenon: AI-exposed companiesin the U.S. increased capital expenditure by nearly 60% over the year to May 2026, nearly ten times the 6% rate ofdomestic non-AI peers, with revenue growth a fraction of that pace. Outside the U.S., the over-expenditure risk is much lower. Taiwan and China recorded strong growth in AI capex,with sales growth tracking closely, suggesting investment is being absorbed productively. Korea reflects areallocation dynamic with AI investment growing modestly while non-AI peers contract. Japan is the only marketwhere AI-exposed companies recorded negative capex growth, with Japan also seeing a small decline in AI sales. Outside of US, AI-related capex is supported by sales One-year growth rate of capital expenditure and sales for AI companies (AI-value-chain score >=10) and no