您的浏览器禁用了JavaScript(一种计算机语言,用以实现您与网页的交互),请解除该禁用,或者联系我们。 [Jefferies]:建筑与施工:月度天气追踪 - 发现报告

建筑与施工:月度天气追踪

建筑建材 2025-06-02 Jefferies 路仁假
报告封面

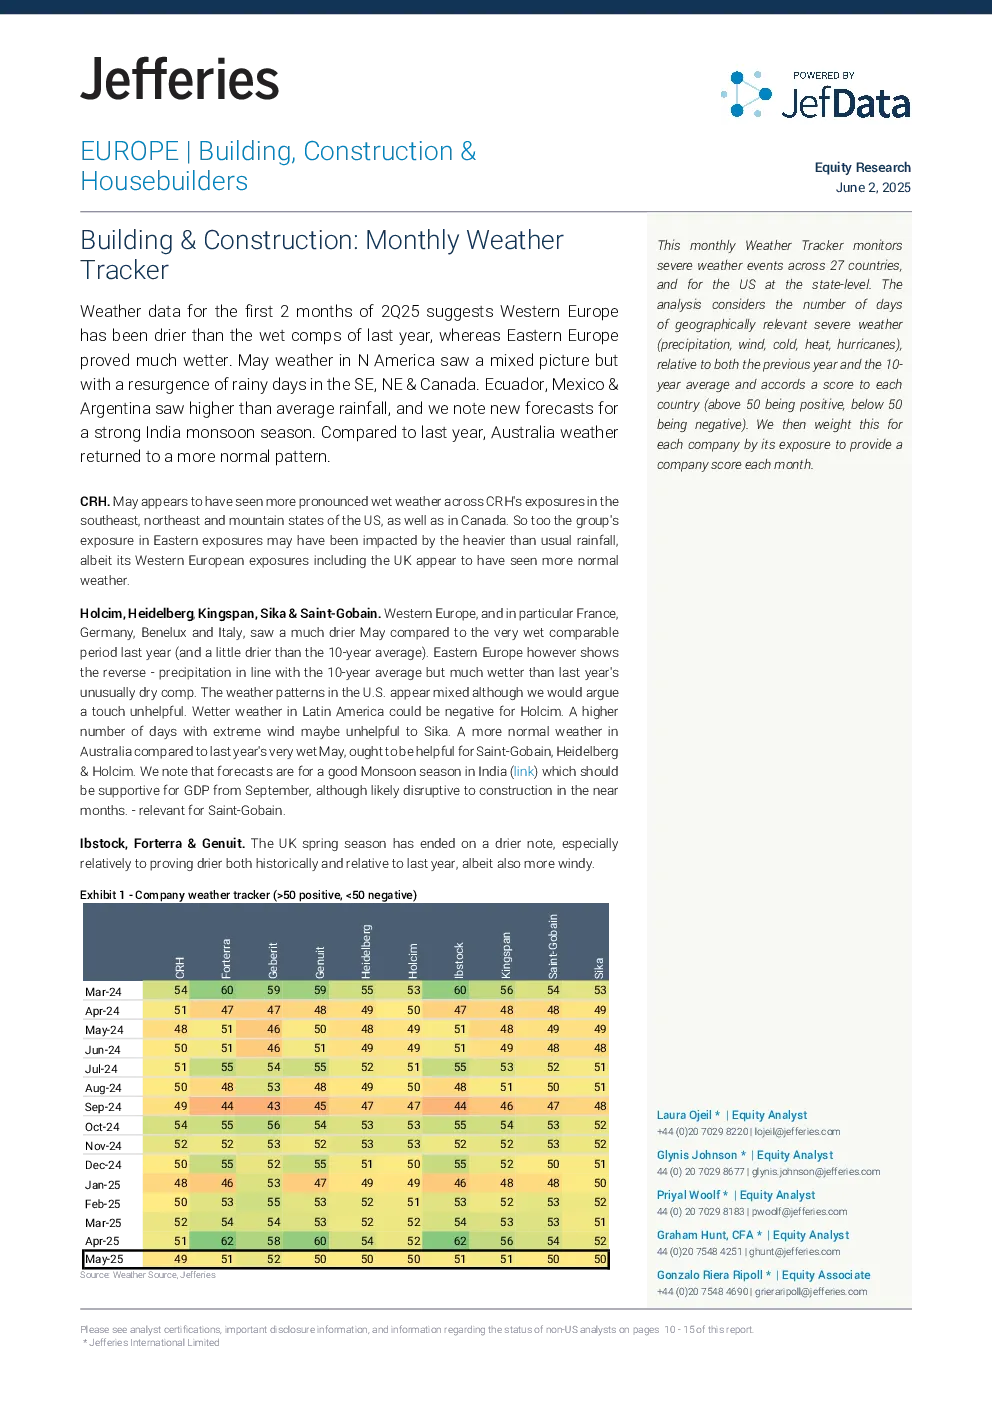
GenuitHeidelbergHolcimIbstock595553604849504750484951514949515552515548495048454747445453535552535352555150554749494653525153535252546054526250505051 Equity ResearchJune 2, 2025+44 (0)20 7029 8220 | lojeil@jefferies.comGlynis Johnson * | Equity Analyst44 (0) 20 7029 8677 | glynis.johnson@jefferies.comPriyal Woolf * | Equity Analyst44 (0) 20 7029 8183 | pwoolf@jefferies.comGraham Hunt, CFA * | Equity Analyst44 (0)20 7548 4251 | ghunt@jefferies.comGonzalo Riera Ripoll * | Equity Associate+44 (0)20 7548 4690 | grieraripoll@jefferies.comThismonthly Weather Tracker monitorssevere weather events across 27 countries,andfor the US at the state-level.Theanalysisconsiders the number of daysof geographically relevant severe weather(precipitation, wind, cold, heat, hurricanes),relative to both the previous year and the 10-year average and accords a score to eachcountry (above 50 being positive, below 50being negative). We then weight this foreach company by its exposure to provide a KingspanSaint-Gobain565448484849494853525150464754535253525048485253535356545150 Laura Ojeil * | Equity Analystcompany score each month. Sika534949485151485252515052515250 Exhibit 7 - Weather Score by US states (>50 positive, <50 negative).AlabamaArizonaArkansasCaliforniaColoradoConnecticutDistrict of ColumbiaFloridaGeorgiaIdahoIllinoisIndianaIowaKansasKentuckyLouisianaMaineMarylandMassachusettsMichiganMinnesotaMississippiMissouriMontanaNebraskaNevadaNew MexicoNew YorkNorth CarolinaNorth DakotaOhioOklahomaOregonPennsylvaniaRhode IslandSouth CarolinaSouth DakotaTennesseeTexasUtahVermontVirginiaWashingtonWest VirginiaWisconsinWyomingSource: Weather Source, JefferiesPlease see important disclosure information on pages 10 - 15 of this report.This report is intended for Jefferies clients only. Unauthorized distribution is prohibited. Exhibit 8 - May 2025 weather tracker in the U.S by state. (>50 positive, <50 negative).CaliforniaSource: Weather Source, JefferiesPlease see important disclosure information on pages 10 - 15 of this report.This report is intended for Jefferies clients only. Unauthorized distribution is prohibited. Scoring Methodology1.ObjectiveThe goal is to measure the change in severe weather events that could affect near-term construction activities for each country. Scores rangefrom 0 to 100, with scores above 50 being positive and scores below 50 being negative.2. Country-Specific MetricsEach country has a unique combination of metrics to calculate the overall score:•Europe: Average of the scores for severe precipitation, cold, and wind.•US: Average of the scores for severe storms, severe precipitation, and cold.•Canada: Average of the scores for severe precipitation and cold.•Latam: Average of the scores for severe precipitation, cold, and heat.•Asia: Average of the scores for severe wind, precipitation, cold, and heat.3. Description of Severe Weather Events•SeverePrecipitation Day: A day with very high precipitation levels, defined as greater than 1 standard deviation above the historical meanfor that month in a region. (1 -> true; 0 -> false)•Severe Windy Day: A day with very high wind speeds, defined as the maximum 2-minute wind speed being greater than 1 standard deviationabove the historical mean for that month in a region. (1 -> true; 0 -> false)•Severe Heat Day: A day where the daily maximum temperature exceeds 40°C. (1 -> true; 0 -> false)•Severe Cold Day: A day where the daily minimum temperature is below 0°C. (1 -> true; 0 -> false)•Severe Storm Day: A day with severe storms, based on specific criteria such as wind speed, precipitation, and other relevant factors for theregion. (1 -> true; 0 -> false)4. Comparison Methods•Year-over-Year (YoY) Comparison: Start with a baseline score of 50, indicating no change. Adjust this score by adding or subtracting basedon the excess or deficit of severe weather days in the current month compared to the same month in the previous year.•10-Year Average Comparison: Similarly, start with a baseline score of 50 and adjust based on the excess or deficit of severe weather daysin the current month compared to the 10-year average for that month.5. Combining the ScoresThe final score for each weather component is the average of the YoY comparison and the 10-year average comparison. The overall countryscore is calculated based on the specific metrics relevant to that country.6. Company Scores CalculationTo measure the impact of severe weather on companies based on their geographic sales distribution:•Multiply the country score by the percentage of sales in that country.•Countries with unknown data are assigned a score of 50 (no change).7. Quarterly CalculationThe same methodology is applied on a quarterly basis, in addition to the monthly calculations.State-Specific Analysis for the USThe same methodology is applied to each state within the US The scores are calculated based on state-specific data for severe storms,severe precipitation, and cold. This state-level analysis may differ