您的浏览器禁用了JavaScript(一种计算机语言,用以实现您与网页的交互),请解除该禁用,或者联系我们。 [美国银行]:中等收入,重大影响 - 发现报告

中等收入,重大影响

文化传媒 2026-07-01 美国银行 SoftGreen
报告封面

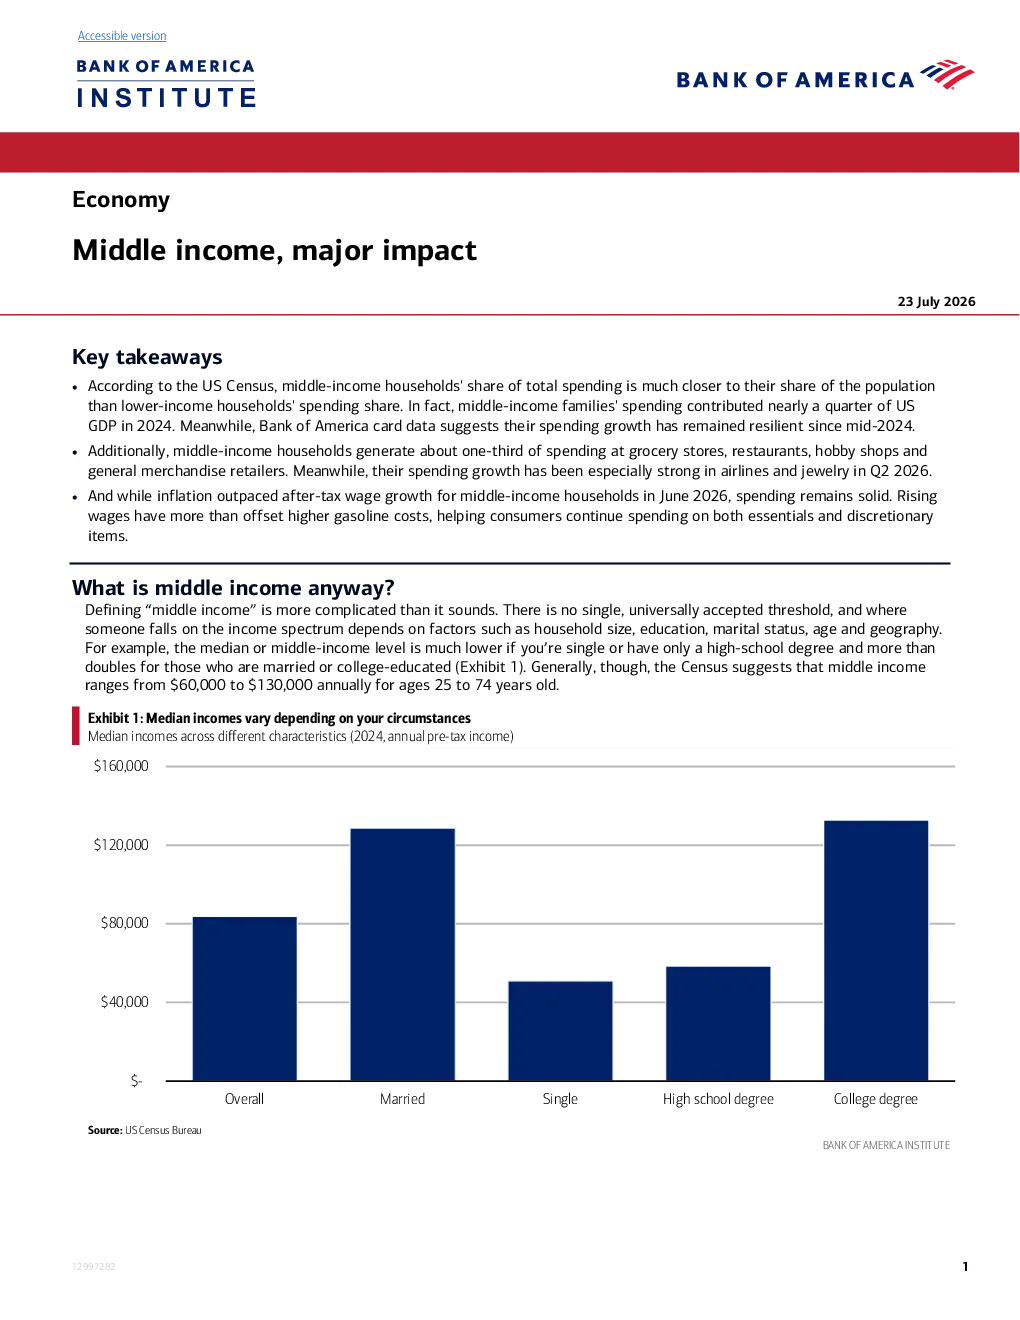
Middle income, major impact Key takeaways •According to the US Census, middle-income households' share of total spending is much closer to their share of the populationthan lower-income households' spending share. In fact, middle-income families' spending contributed nearly a quarter of USGDP in 2024. Meanwhile, Bank of America card data suggests their spending growth has remained resilient since mid-2024. •Additionally, middle-income households generate about one-third of spending at grocery stores, restaurants, hobby shops andgeneral merchandise retailers. Meanwhile, their spending growth has been especially strong in airlines and jewelry in Q2 2026. •And while inflation outpaced after-tax wage growth for middle-income households in June 2026, spending remains solid. Risingwages have more than offset higher gasoline costs, helping consumers continue spending on both essentials and discretionaryitems. What is middle income anyway?Defining“middle income”is more complicated than it sounds. There is no single, universally accepted threshold, and where someone falls on the income spectrum depends on factors such as household size, education, marital status, age and geography.For example, the median or middle-income level is much lower if you’re single or have only a high-school degree and more thandoubles for those who are married or college-educated (Exhibit 1). Generally, though, the Census suggests that middle incomeranges from $60,000 to $130,000 annually for ages 25 to 74 years old. Middle-income households’ spending contributed nearly a quarter of GDP in 2024Notably, while lower-income households punch well below their weight in total consumer spending, according to Census figures, middle-income households’share of spending is closer to their share of the population (Exhibit 2). And as for their contributionsto the overall economy, middle-income families’spending accounted for nearly a quarter of US gross domestic product (GDP) in2024 (Exhibit 3). Exhibit3:Middle-income households’ spending alone accountedfornearly a quarter of GDP Exhibit2:Middle-income households’shareof spendingissomewhat proportionate to their share of total householdsShare of all expenditures or spending by grouped income deciles (2024, Share of GDP by different categories (personal consumer expenditures(PCE), 2024, %) %) Middle-income households’ spending has held up well since last yearSo, how has spending by middle-income households–defined here and below as the middle third of households by income– held up since 2024? Bank of America credit and debit card data suggests this cohort’s spending growth has improved since lastyear. And though their overall card year-over-year (YoY) spending growth has eased slightly compared to lower-income families,they are still outpacing them on discretionary spending growth (Exhibit 4andExhibit 5). This suggests, in our view, that themiddle-income cohort’s contribution to GDP has remained robust. Exhibit4:Higher-income households’spending rose to 5.8% YoY inJune compared to 4.8% for lower- and middle-income householdsTotal credit and debit card spending per household, by household income Exhibit5:Discretionary spending growth improved the most forhigher- and lower-income households in JuneDiscretionary card spending per household by income tercile (SA, YoY%) tercile (three-month moving average, YoY%, seasonally adjusted (SA)) Groceries, hobbies and general merchandise depend on the middleSo, which categories depend on those earning middle incomes? According to Bank of America card data, middle-income families account for slightly over a third of spending at grocery stores, hobby shops and general merchandise retailers in the twelvemonths ending in June 2026 (Exhibit 6). Meanwhile, restaurants rely on middle-income households for nearly a third of theirrevenue, corresponding to their share of households. Meanwhile, this cohort still contributes a meaningful, though smaller, shareof total spending in higher ticket categories like furniture, airlines and jewelry. Share of category spending from middle-income households (rolling 12-month sum to June 2026, %) Looking across some of these categories, middle-income households have accelerated their spending growth in airlines, clothingand restaurants during Q2 2026 from the first quarter (Exhibit 7). And while spending growth has decelerated in jewelry andgeneral merchandise, it is still solidly positive. Conversely, spending at grocery stores was flat and down slightly YoY at furnitureand department stores in the second quarter of this year. What’s next for middle-income households’ spending?As of June 2026, inflation outpaced middle-income households’after-tax wage growth, based on a comparison of Bank of America deposit data and consumer price index (CPI) inflation data from the Bureau of Labor Statistics (BLS) (Exhibit 8). Thissuggests that some middle-income families are seeing prices increase faster than their wages. Notabl