2026实地需求监测系列第80期:铝库存与消费
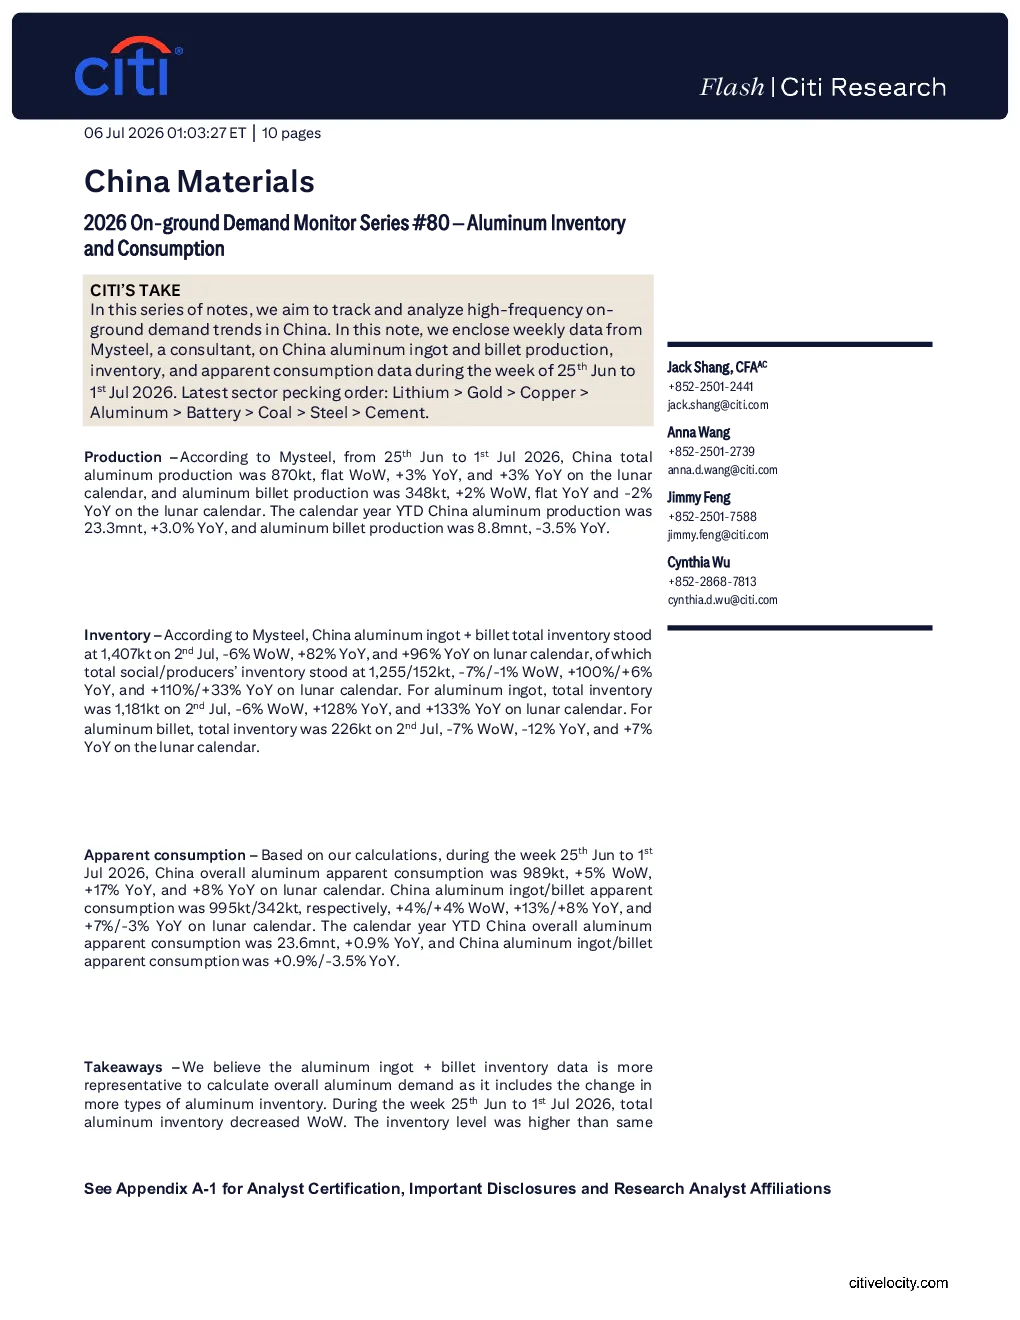
中国材料 2026 现货需求监测系列第80期——铝库存与消费 中信的观点 在本系列笔记中,我们旨在追踪和分析中国高频现货需求趋势。在本期笔记中,我们附上了咨询公司MySteel关于2026年6月25日至7月1日期间的中国铝锭和铝棒生产、库存及表观消费数据。最新行业格局:锂 > 黄金 > 铜 > 铝> 电池 > 煤炭 > 钢材 > 水泥。 AC+852-2501-2441jack.shang@citi.com尚杰,CFA +852-2501-2739anna.d.wang@citi.com王安娜 生产——据Mysteel数据,2026年6月25日至7月1日,中国铝总产量为870万吨,当周持平,同比增长3%,按农历同比增长3%;铝棒产量为348万吨,当周增长2%,同比持平,按农历下降2%。日历年累计,中国铝产量为2330万吨,同比增长3.0%,铝棒产量为880万吨,同比下降3.5%。 +852-2501-7588jimmy.feng@citi.com冯吉米 +852-2868-7813cynthia.d.wu@citi.com吴茜茜 库存——据Mysteel数据,7月2日中国铝锭+铝棒总库存为1407万吨,环比下降6%,同比增长82%,按农历同比增长96%。其中社会库存/生产商库存分别为1255万吨/152万吨,环比下降7%/下降1%,同比增长100%/增长6%,按农历同比增长110%/增长33%。铝锭方面,7月2日总库存为1181万吨,环比下降6%,同比增长128%,按农历同比增长133%。铝棒方面,7月2日总库存为226万吨,环比下降7%,同比下降12%,按农历同比增长7%。 显性消费——根据我们的计算,2026年6月25日至7月1日期间的周内,中国整体铝显性消费量为989万吨,环比增长5%,同比增长17%,按农历计算同比增长8%。中国铝锭/铝棒显性消费量分别为995万吨和342万吨,环比分别增长4%,同比增长13%和8%,按农历计算同比增长7%和-3%。同年累计至2026年6月30日,中国整体铝显性消费量为2360万吨,同比增长0.9%,中国铝锭/铝棒显性消费量同比增长0.9%和-3.5%。 要点——我们认为,铝锭+铝坯库存数据更能代表总体铝需求,因为它包含了更多类型铝库存的变化。在2026年6月25日至7月1日当周,总铝库存环比下降。库存水平高于同期。 参见附录A-1,了解分析师资质认证、重要披露和研究分析师关联方信息。 2021-25年农历周期。本周铝表观消费量环比增长,且表观消费水平高于2022-25年农历同期。 © 2026 摩根大通公司。未经摩根大通书面许可,不得转载或分发。 © 2026 摩根大通公司。未经摩根大通书面许可,不得转载或分发。 注意:在X轴上,CNY代表中国新年,数据按周统计 注意:在X轴上,CNY代表中国新年,数据按周统计 © 2026 摩根大通公司。未经摩根大通书面许可,不得转载或分发给第三方。注意:在X轴上,CNY代表中国新年,数据按周统计。 花旗研究,mysteel 花旗研究,mysteel © 2026 摩根大通公司。未经摩根大通书面许可,不得转载或分发。注意:在X轴上,CNY代表中国新年,数据为几周 花旗研究,mysteel 如果您视力受损,并希望就本文件中的图形细节与花旗代表通话,请从美国境内拨打1-888-500-5008(TTY:711),或从美国境外拨打+1-210-677-3788。 附录A-1 分析师认证 本研究报告的编制和内容主要负责研究人员,要么(i)在作者栏中标注为“AC”,要么(ii)与归属于该分析师的内容一同加粗列出。如果在作者栏中标注了多位AC分析师,则每位分析师均对整个研究报告负责,但(a)不包括加粗列出的归属于另一位负责认证的AC分析师的内容,以及(b)仅针对特定发行人的观点,这些观点归属于下方价格图表或评级历史表中识别出的另一位负责认证的AC分析师。每位分析师均就其负责的报告部分进行认证:(1)报告中所表达的观点准确反映了他们对所提及的每位发行人和证券的个人看法,并且是以独立方式准备的,包括涉及花旗全球市场公司及其附属公司的情况;以及(2)研究分析师的任何部分薪酬,现在或将来,均未直接或间接地与其在本报告中提出的具体建议或观点相关。 重要披露 分析师的薪酬由花旗研究管理部门和花旗集团高级管理层确定,其依据是旨在为花旗全球市场公司及其附属公司(以下简称“公司”)的投资者客户带来利益的活动和服务。薪酬与具体交易或建议无关。与公司所有员工一样,分析师的薪酬会受到公司整体盈利能力的影响,而公司整体盈利能力包括投资银行、销售与交易以及主经纪业务收入。股票研究分析师薪酬的一个因素是安排机构客户与所覆盖公司管理团队之间的企业接触活动。通常,当分析师对公司持正面看法时,公司管理层更可能参与。 对于产品中,该机构并非做市商的金融工具,该机构是此类金融工具(及任何衍生工具)的流动性提供者,并可能在此类工具的交易中作为交易主方。该机构是已交易与证券相关的金融工具的定期发行人,这些证券可能已在产品中获推荐。该机构定期交易产品中讨论的发行人的证券。该机构可能以与产品不一致的方式从事证券交易,并且对于产品所涵盖的证券,将基于主方身份向客户买入或卖出。 除非另有说明,否则研究分析师及其团队成员在过去12个月内均未审阅过所提供投资意见的相关公司的实际运营情况。 就与本Citi Research产品相关公司(包括历史披露文件的副本)的重要披露,请联系Citi Research,地址:纽约格林威治街388号6楼,邮编10013,收件人:法律/合规部[E6WYB6412478]。此外,除估值与风险评估和历史披露外,相同的重要披露亦包含在公司披露网站上。 https://www.citivelocity.com/cvr/eppublic/citi_research_disclosures评估和风险评估可在关于该目标公司的最新研究笔记/报告中找到。根据《市场滥用条例》,过去12个月内发布的所有花旗研究建议可通过花旗速度(Citi Velocity)获取。) 或您的标准分发门户。历史披露(长达过去三年)将在要求时提供。 https://www.citivelocity.com/cv2 花旗研究:基础研究投资评级指南花旗研究股票推荐包含投资评级,并提供可选的风险评级以突出高风险股票。风险评级综合考虑价格波动和基本面标准。股票要么 没有风险评级,要么被评定为高风险评级。 投资评级:花旗研究投资评级分为买入、中性及卖出。我们的评级由分析师预期总回报(ETR)和风险预期。ETR是指在未来12个月内,某股票预测价格上涨(或下跌)加上股息收益率的总和。目标价格基于1 2个月的时间范围。投资评级定义如下:买入(1)高风险股票的ETR为15%或更高,或25%或更高;卖出(3)为负ETR。任何未获得买入或卖出评级的覆盖股票均为中性(2)。对于评级为中性(2)的股票,如果分析师认为缺乏估值驱动因素和/或投资催化剂来得出正面或负面投资观点,他们可以经批准选择 花旗研究管理层可能不会设定目标价,因此也不会得出预期总回报率(ETR)。由于监管要求或内部政策原因,花旗研究可能暂停其评级和目标价,并将状态标为“评级暂停”。花旗研究也可能因其他特殊情况(例如,缺乏对分析师论点至关重要的信息、交易暂停)影响公司及其证券的交易而暂停评级和目标价,并将状态标为“审阅中”。在这两种情况下,评级和目标价将在评级历史价格图中分别显示为“—”和“-”。在2022年4月11日之前,花旗研究对上述两种情况都标为“审阅中”,而在2020年11月11日之前,仅在特殊情况下才标为“审阅中”。在切实可行的情况下,分析师将尽快发布一份报告,重新建立评级和投资论点。投资评级在覆盖率启动时、投资和/或风险评级发生变化,或目标价发生变化时(受管理层有限权限约束)确定。有时,由于市场价格波动和/或其他短期波动或交易模式,预期的总回报率可能会超出上述范围。这种暂时性偏差将予以允许,但将受到研究管理层的审查。您买卖证券的决定应基于您的个人投资目标,并且只有在评估了股票的预期表现和风险之后才能做出。 催化剂观察/短期观点(“STV”)评级披露:催化剂观察及STV多空评级:花旗研究部门也可能发布催化剂观察或多空评级(STV Upside/Downside call),以表明分析师预期在 特定30或90天期间内,由于一个或多个具体的短期催化剂或事件对公司或市场产生影响,股价将(上涨/下跌)。当分析师高度确信股价将受影响时,将发布催化剂观察;当信心程度为中等时,则为STV评级。催化剂观察或STV多空评级将在指定的30/90天期限结束时自动失效。若股价表现(以收盘价计算)超出评级方向15%(除非分析师覆盖),催化剂观察也将自动移除。分析师也可能在指定期限结束前,通过发布研究报告移除催化剂观察或多空评级。催化剂观察/STV多空评级可能与股票的基本股权评级不同,后者反映的是更长期的绝对回报预期。根据FINRA评级分配披露规则,催化剂观察/STV看涨评级对应买入建议,而催化剂观察/STV看跌评级对应卖出建议。未分配至催化剂观察看涨、催化剂观察看跌、STV看涨或STV看跌评级的股票被视为催化剂观察/STV无观点。根据FINRA评级分配披露规则,我们将催化剂观察/STV无观点对应于我们催化剂观察/STV多空评级系统中的持有评级。然而,我们重申,我们不认为无观点是一种建议。对于所有催化剂观察/STV多空评级,存在催化剂及关联股价变动未达预期的风险。 研究员关联方 / 非美国研究员披露本报告作者就职的法人在下文列出(其监管机构亦在本报告中列出)。非美国的研究分析师(即除被认定为受雇于花旗全球市场公 司(Citigroup Global Markets Inc.)之外的所有列名研究分析师)未在FINRA注册或具备研究分析师资格。此类研究分析师可能不是会员机构的关联人(但受雇于会员机构的关联公司),因此可能不受FINRA规则2241关于与目标公司沟通、公开露面及研究分析师账户持有的证券交易等限制。 其他披露 花旗研究已实施政策,用于识别、考虑和管理因投资研究报告的发布或分发而产生的潜在利益冲突。这些政策的说明可在 https://www.citivelocity.com/cvr/eppublic/citi_research_disclosures 查找。 过去12个月内,截至每个季度末,花旗研究所有研究建议中相当于“买入”、“持有”、“卖出”的比例(括号内显示的是过去12个月获得花旗投资公司服务的这些建议的百分比)如下;2026年第一季度 买入33%(63%),持有44%(52%),卖出23%(46%),相对价值0.5%(89%);2025年第四季度 买入33%(63%),持有44%(50%),卖出23%(46%),相对价值0.4%(91%);2025年第三季度 买入33%(61%),持有44%(52%),卖出23%(50%),相对价值0.4%(80%);2025年第二季度 买入33%(63%),持有44%(51%),卖出23%(49%),相对价值0.4%(86%)。为披露除股票以外的建议(其定义可在相应的披露部分找到),“买入”指一个正向交易思路;“卖出”指一个负向交易思路;而“相对价值”指任何没有明确投资策略方向交易思路。 发行人,包括应影响发行人的新闻。对于非基本面研究报告,花旗研究可能不会定期更新报告中包含的观点、建议和事实。尽管花旗研究对发行人保持覆盖、提出建议或进行讨论,但由于法律或政策原因,花旗研究可能被定期限制提及某些发行人。如果已发布交易想法的某个组成部分受到限制,该交易想法将从产品中包含的任何公开交易想法列表中移除。在限制解除后,如果分析师继续支持,交易想法将重新列入公开交易想法列表,或者将被正式关闭。花旗研究可能向不同类别的客户(例如,基于长期或短期投资视野)提供不同的