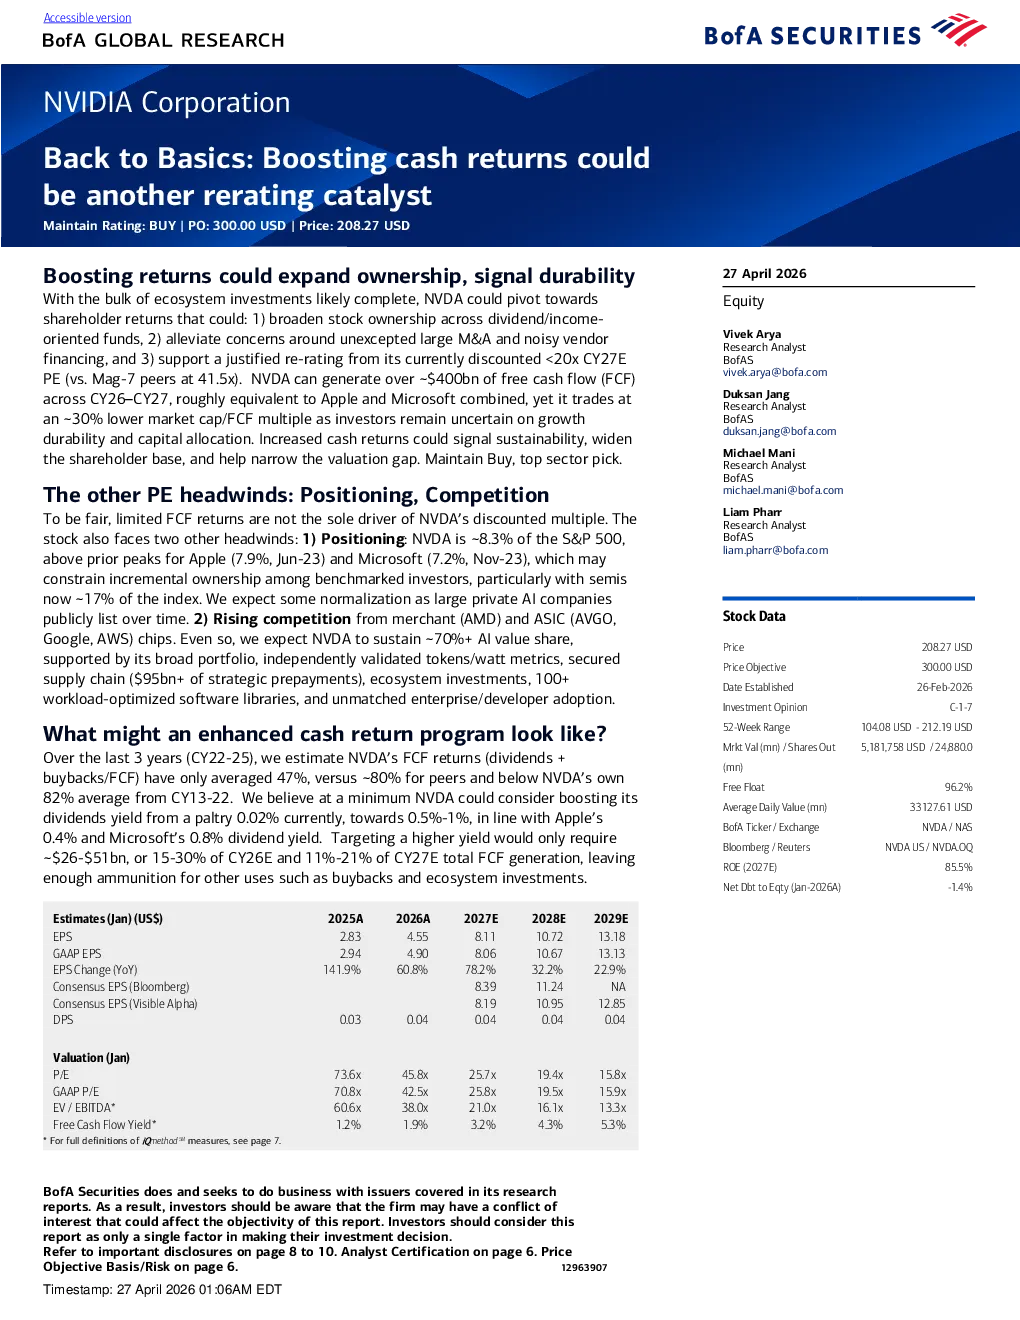
Back to Basics: Boosting cash returns couldbe another rerating catalyst Maintain Rating: BUY | PO: 300.00 USD | Price: 208.27 USD Boosting returns could expand ownership, signal durabilityWith the bulk of ecosystem investments likely complete,NVDA could pivot towards 27 April 2026 shareholder returns that could: 1) broaden stock ownership across dividend/income-oriented funds, 2) alleviate concerns around unexcepted large M&A and noisy vendorfinancing, and 3) support a justified re-rating from its currently discounted <20x CY27EPE (vs. Mag-7 peers at 41.5x). NVDA can generate over ~$400bn of free cash flow (FCF)across CY26–CY27, roughly equivalent to Apple and Microsoft combined, yet it trades atan ~30% lower market cap/FCF multiple as investors remain uncertain on growthdurability and capital allocation. Increased cash returns could signal sustainability, widenthe shareholder base, and help narrow the valuation gap. Maintain Buy, top sector pick. Equity Vivek AryaResearch AnalystBofASvivek.arya@bofa.com Duksan JangResearch AnalystBofASduksan.jang@bofa.com Michael ManiResearch AnalystBofASmichael.mani@bofa.com The other PE headwinds: Positioning, Competition Liam PharrResearch AnalystBofASliam.pharr@bofa.com To be fair, limited FCF returns are not the sole driver of NVDA’s discounted multiple. Thestock also faces twoother headwinds:1) Positioning: NVDA is ~8.3% of the S&P 500,above prior peaks for Apple (7.9%, Jun-23) and Microsoft (7.2%, Nov-23), which mayconstrain incremental ownership among benchmarked investors, particularly with semisnow ~17% of the index. We expect some normalization as large private AI companiespublicly list over time.2) Rising competitionfrom merchant (AMD) and ASIC (AVGO,Google, AWS) chips. Even so, we expect NVDA to sustain ~70%+ AI value share,supported by its broad portfolio, independently validated tokens/watt metrics, securedsupply chain ($95bn+ of strategic prepayments), ecosystem investments, 100+workload-optimized software libraries, and unmatched enterprise/developer adoption. Price208.27 USDPrice Objective300.00 USDDate Established26-Feb-2026Investment OpinionC-1-752-Week Range104.08 USD - 212.19 USDMrkt Val (mn) / Shares Out5,181,758 USD / 24,880.0 What might an enhanced cash return program look like? Over the last 3 years (CY22-25), we estimate NVDA’s FCF returns (dividends +buybacks/FCF) have only averaged 47%, versus ~80% for peers and below NVDA’s own82% average from CY13-22. We believe at a minimum NVDA could consider boosting itsdividends yield from a paltry 0.02% currently, towards 0.5%-1%, in line with Apple’s0.4% and Microsoft’s 0.8% dividend yield. Targeting a higher yield would only require~$26-$51bn, or 15-30% of CY26E and 11%-21% of CY27E total FCF generation, leavingenough ammunition for other uses such as buybacks and ecosystem investments. Timestamp: 27 April 2026 01:06AM EDT iQprofileSMNVIDIA Corporation Company SectorSemiconductors Company Description Nvidia designs and sell graphics and video processing chipsfor desktop and notebook gaming PCs, workstations, gameconsoles, and accelerated computing servers andsupercomputers. Investment Rationale Our positive view on Nvidia is based on itsunderappreciated transformation from a traditional PCgraphics chip vendor, into a supplier into high-end gaming,enterprise graphics, cloud, accelerated computing andautomotive markets. The company has executedconsistently and has a solid balance sheet withdemonstrated commitment to capital returns. Stock Data Average Daily Volume161,006,608 NVDA at Unjustified Valuation Discount vs. Mag-7 PeersBased on consensus estimates, NVDA is trading at a significant discount to its large-cap growth, the so-called Magnbificent-7 or Mag-7 peers. ON a PE basis, NVDA’s 26x/19xCY26/27E PE is a nearly 50% discount to Mag-7 average of 49x/42x. On a FCF basis,NVDA’s 28x/20x EV/FCF is an even greater 66% discount. On a normalizedPrice/Earnings Ratio or PEG, NVDA is trading at a 0.36xx PEG., well below peersaveraging 2.61x and even the broader S&P 500 market at 1.3x+ PEG. CY26/27E PE, EV/FCF, Sales and EPS CAGR and PEG multiple for NVDA versus other large cap growth peers NVDA same FCF as Apple + Microsoft but with 30% lessmarket cap The historical pivot towards FCF returns at Apple and Microsoft is well known. While itcertainly was not the only reason for their enhanced PE multiples, it likely created a classof sticky shareholders, including possible attraction of dividend growth and incomegrowth funds. While NVDA at $5.08T is the largest market cap in the S&P 500 index, ittrades at a ~29% discount to the combined $7Tn+ market cap of Apple and Microsoftcombined despite the potential for generating the same amount of free cash flow. NVDA under-represented in dividend/income funds Per analysis from our BofA Strategy team, using data from Lipper/EPFR: 1)While there isn’t a perfect accounting, US mutual funds with“income”or“dividend”in their clear mandate or wher