潮起:亚太海运的未来
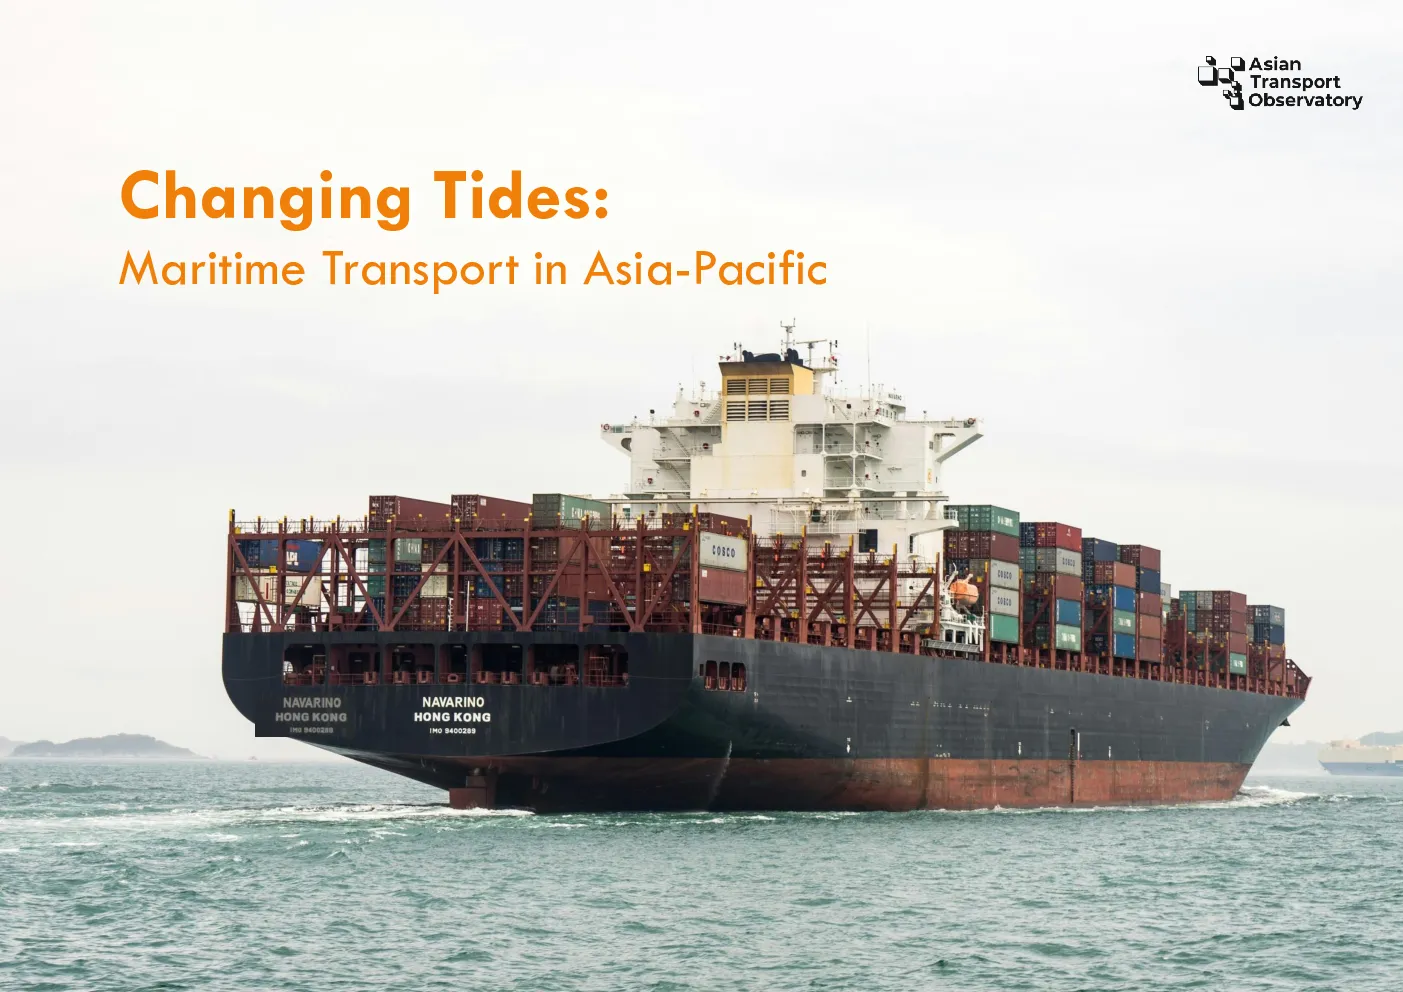
Maritime Transport inAsia-Pacific An Asian Transport Observatory (ATO) Publication Changing Tides: Maritime Transport in Asia Pacific September2025 Contributors: Sudhir Gota, Alvin Mejia, Mel Eden, Adwait Limaye, Benjamin Soco Cover page picture credits: Kinsey Wang (unsplash) Suggested citation: Asian Transport Observatory.(September2025). Changing tides: Maritime Transport in AsiaPacific. Asian Transport Observatory. https://hdl.handle.net/20.500.14706/01.022.00;https://asiantransportobservatory.org/analytical-outputs/maritime-transport-2025 Disclaimer:The Asian Transport Observatory(ATO)project collects,collates,and organizes data from publiclyavailableofficial,aswellasreputableandpeer-reviewedsecondarysources,whichmay containincompleteorinconsistentdata.ItisimportanttonotethattheATOdoesnotgeneratedata.Moreover,whiletheATOcarriesoutqualitycontrolandassuranceofwhetherthedataaretruthfullyreflectedintheATO,theATOdoesnotmakeanywarrantiesorrepresentationsastotheappropriateness,quality,accuracy,orcompletenessofthedataintheATO Summary Theworld'seconomiccenterofgravityhasmoved.TheAsia-Pacificregion,hometohalftheplanet'speopleandeconomicoutput,is now the pivot of global trade.What happens on its waters—stagnation or progress— Theoceancarriestheworld'sgoods.Roughly80%ofallinternationaltrademovesbysea;formanydevelopingAsiannations,the share is higher still.In 2023,this trade surpassed 12 billion tons.Asian developing nations alone discharged47%of this global volume.The region's dominance is absolute.This is where the world's fleet ismanufactured.In 2024,Asia builtabout 98%of the world's largemerchant ships.Three nations—thePeople'sRepublicofChina,theRepublicofKorea,andJapan—delivered93%ofallnewtonnagein2022.Theportsarehere,too.Asiacontrolshalfoftheworld'sportcapacityandhandlestwo-thirdsofglobalcontainerthroughput.Eight Yet,this aggregate success conceals deep fault lines.Our assessment reveals that the convergent forces ofdecarbonization,digitalization,and geopolitics are remaking the architecture of maritime transport.Thistransformationunfoldsonfiveinterconnectedfronts. First,the technological.The International MaritimeOrganization's mandatefor net-zeroemissions creates anewpathwayfor shipping.Yet the domestic sector,a growing source of both carbon and air pollutants,remainsoverwhelminglydependentonlegacyfuels.Theshapeofthetransitionwilldependontheinterplayofregulation, Thesecondfrontisphysical.Asiaiswarmingatnearlydoubletheglobalaverage.Theregion'sportsrepresentasystemicrisktotheglobaleconomy.Tradelossesfromasingleportfailurecanbe100timesgreaterthanthecostofthephysicaldamage.Theeconomiccaseforresilienceisacalculationofaverteddisruption. Asia-Pacific region, home to half the planet's people andeconomic output, is now the pivot of global trade Thethirdfrontisequity.Adivergenceisclear.Whilehyper-connectedhubsinEastandSoutheastAsiaautomateandexpand,thePacificSmallIslandDevelopingStatesarestillisolated.Connectivitysuffers.Thecostsofclimateinactionaremounting.Inlandwaterways,avastbutneglectedasset,seepassengerservicesdecayfromalackofinvestment. Thefourth front is human.This transition rests on the shouldersof the maritime workforce.The globalmaritimeworkforceispredominantlyAsian.Theshifttowardautomation,greenfuels,andresilientinfrastructuredemandsaparallelinvestmentinnewskills.Ajusttransitionisessentialtoensurethisworkforceisretrainedandupskilled,notleftbehind.Thisisalsoanopportunitytoaddresslong-standingdisparities,suchasthefactthatwomencompriseamere Thefifthfrontismoney.Thecapitalrequiredisnotpresent.OfficialDevelopmentAssistanceisafractionofwhatisneeded.Private sector investment in ports has fallen sharply over the past decade.Without stable,long-term regulatoryframeworks,private capital remains on the sidelines.As the United Nations Decade of SustainableTransportbegins,thesituationisclear.Thetransitioncanbemanagedwithforesight,oritwillbemanagedbythecrisesthatfollow.Thepathwaysoutlinedinthisreportarenotpredictions.Theyarepossibilities,contingentonthe Contents List of Figures Figure 1: Trade modal share, computed by value (2015)Figure 2: Trade modal share, computed by volume (2015)Figure 3: Total maritime trade, percentage shares by region, 2000–2023Figure 4: Flags of Registration (Number of Vessels)Figure 5: Number of vessels by flagFigure 6: Merchant fleet (dead weight tonnage) in Asia-Pacific, per ship type 1980-2024Figure 7: Ships built by country of building, annual (gross tonnage)Figure 8: Maritime PortsFigure 9: Container port throughputFigure 10: Container Port Performance Index (2023) and Total CallsFigure 11: Inland waterwaysFigure 12: Coastal shipping and Inland Waterways Traffic (Billion Tons)Figure 13: People's Republic of China-Freight Ton-KilometersFigure 14: Freight Demand, Trillion Ton-KilometersFigure 15: Fleet Demand (thousand of vehicles)-Domestic Shipping in Asia PacificFigure 16: Liner shipping connectivity index (2006-2023)Figure 17: Domestic navigation energy consumption,