您的浏览器禁用了JavaScript(一种计算机语言,用以实现您与网页的交互),请解除该禁用,或者联系我们。 [美国银行]:区域综述:支出变化 - 发现报告

区域综述:支出变化

房地产 2026-07-01 美国银行 话唠
报告封面

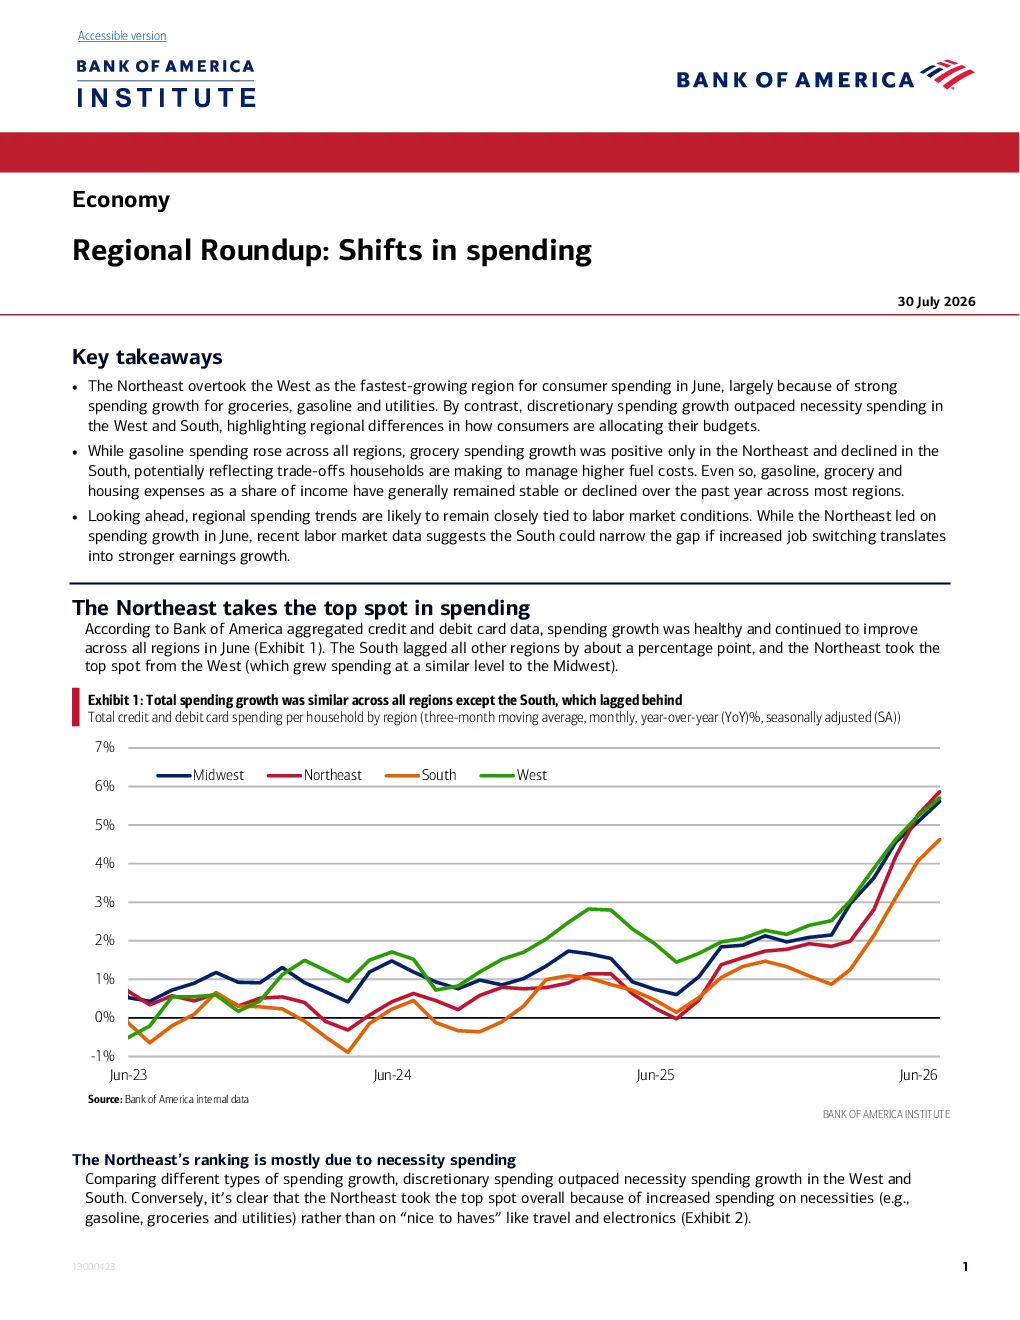
Regional Roundup: Shifts in spending Key takeaways •The Northeast overtook the West as the fastest-growing region for consumer spending in June, largely because of strongspending growth for groceries, gasoline and utilities. By contrast, discretionary spending growth outpaced necessity spending inthe West and South, highlighting regional differences in how consumers are allocating their budgets. •While gasoline spending rose across all regions, grocery spending growth was positive only in the Northeast and declined in theSouth, potentially reflecting trade-offs households are making to manage higher fuel costs. Even so, gasoline, grocery andhousing expenses as a share of income have generally remained stable or declined over the past year across most regions. •Looking ahead, regional spending trends are likely to remain closely tied to labor market conditions. While the Northeast led onspending growth in June, recent labor market data suggests the South could narrow the gap if increased job switching translatesinto stronger earnings growth. The Northeast takes the top spot in spendingAccording to Bank of America aggregated credit and debit card data, spending growth was healthy and continued to improve across all regions in June (Exhibit 1). The South lagged all other regions by about a percentage point, and the Northeast took thetop spot from the West (which grew spending at a similar level to the Midwest). Total credit and debit card spending per household by region (three-month moving average, monthly,year-over-year (YoY)%, seasonally adjusted (SA)) The Northeast’s ranking is mostly due to necessity spendingComparing different types of spending growth, discretionary spending outpaced necessity spending growth in the West and South. Conversely, it’s clear that the Northeast took the top spot overall because of increased spending on necessities (e.g.,gasoline, groceries and utilities) rather than on“nice to haves”like travel and electronics (Exhibit 2). The Northeast leads in wage growth and gasoline and grocery spending increasesAnother reason for the gap between regions might be the labor market–but more specifically, people’s take-home pay. After- tax wage growth has been more muted in the South, according to Bank of America deposit data (Exhibit 3). In fact, the Southhad the slowest wage growth of all regions in June, though by a small margin. The Northeast, by contrast, had the strongestafter-tax wage growth, just edging out the Midwest and West. The Northeast was the only region to increase grocery spending in JuneNotably, while gasoline spending grew significantly in all regions, the Northeast was the only region where grocery spending growth was also positive (Exhibit 4). Spending was flat in most other regions, while grocery spending in the South decreased by1% YoY, according to Bank of America card data. In our view, it’s likely that consumers across most of the US are making trade-offs, choosing to spend less at the grocery storebecause of higher prices at the pump. One way people can make trade-offs is to do more of their shopping at value or discountgrocery stores (read more in our publication:The rise in value). Even so, Bank of America card data suggests this trend varies byregion. For example, the South has the largest share of grocery spending at value grocers (Exhibit 5). Meanwhile, the Midwestand Northeast have the lowest share–though it’s possible people in these regions are moving more of their food spending tobig box stores or are purchasing less expensive store brands or private labels. Exhibit4:Gasoline and groceries spending growth was strongest inthe NortheastPer household spending on gasoline (June 2026, YoY%) and groceries Exhibit5:The South had the highest share of grocery spending atvalue grocers, while the Northeast had one of the lowestShare of grocery spending at value grocers (June 2026, %) (June 2026, YoY%, right-hand side (rhs)) All regions have mostly kept price hikes in gas and groceries at bayIt seems these trade-offs have allowed consumers to keep gasoline and grocery spending, as a share of their income, constant over the past year. New England, located in the Northeast, was the only Census division that saw an increase in the share ofgrocery and gasoline spending in June, at less than a percentage point (Exhibit 6). Exhibit6:Gasoline and grocery spending as a share of income has actually decreased everywhere but in New England over the past yearMedian gas and grocery spending as a share of median income by US Census Division (monthly, %) The pattern is the same when examining rent as a share of income, increasing to 34% in New England in June 2026, up slightlyfrom 33% in the previous year, according to Bank of America payments data (Exhibit 7). The proportion declined, however, in allother Census regions. In our view, this is critically important for consumer health, as housing is often the largest expense of anyhousehold budget, according to t