全球ESS追踪器 - 2026年7月:中国储能出货量达到新高
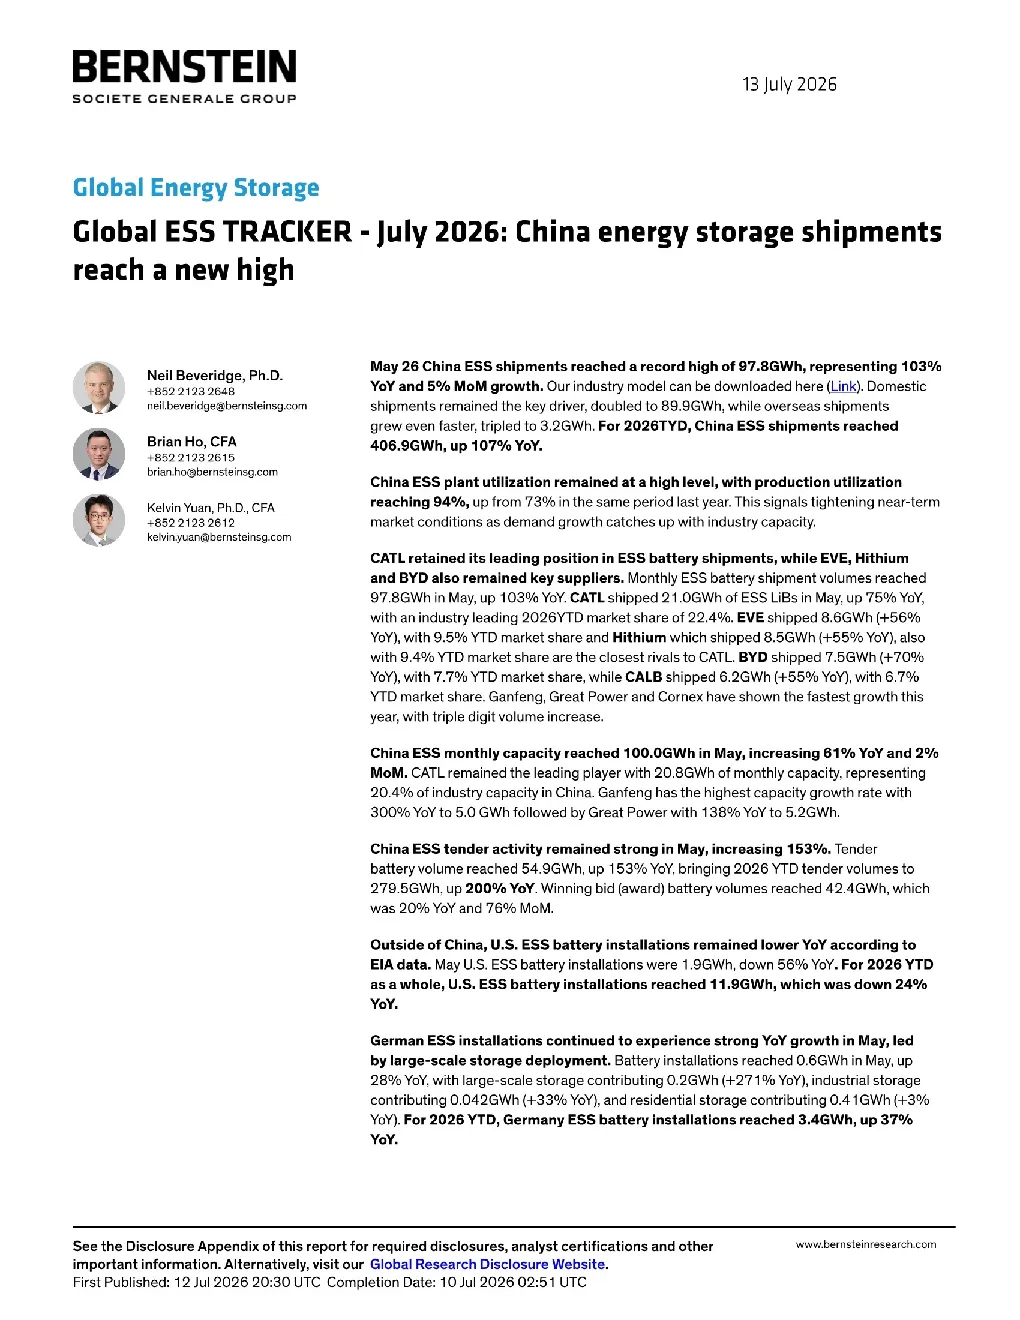
Global ESS TRACKER - July 2026: China energy storage shipmentsreach a new high YoY and 5%MoMgrowth.Our industrymodel can bedownloaded here (Link).Domesticshipments remained the key driver, doubled to 89.9GWh, while overseas shipmentsgrew even faster, tripled to 3.2GWh.For 2026TYD, China ESS shipments reached406.9GWh,up107%YoY +85221232648neil.beveridge@bernsteinsg.com +85221232615brian.ho@bernsteinsg.con reaching 94%,up from 73% in the same period last year.This signals tightening near-termmarket conditions as demand growth catches up with industry capacity. +85221232612kelvin.yuan@bernsteinsg.com andBYDalsoremainedkeysuppliers.MonthlyESSbatteryshipmentvolumes reached97.8GWh in May, up 103% YoY. CATL shipped 21.0GWh of ESS LiBs in May, up 75% YoY,with an industryleading2026YTDmarket share of22.4%.EVE shipped 8.6GWh(+56%YoY), with 9.5% YTD market share and Hithium which shipped 8.5GWh (+55% YoY), alsowith9.4%YTDmarketsharearetheclosestrivalstoCATL.BYDshipped 7.5GWh (+7O%YoY), with 7.7% YTD market share, while CALB shipped 6.2GWh (+55% YoY), with 6.7%YTD market share.Ganfeng,Great Powerand Cornex haveshown thefastest growth thisyear, with triple digit volume increase. ChinaESSmonthlycapacityreached100.0GWh inMay,increasing61%YoYand2%MoM.CATLremained the leading player with 20.8GWh of monthly capacity,representing20.4% of industry capacity in China. Ganfeng has the highest capacity growth rate with300%YoY to5.0GWhfollowed byGreatPowerwith138%YoYto5.2GWh. China ESStenderactivityremained strong in May,increasing 153%.Tenderbatteryvolumereached54.9GWh,up153%YoY,bringing2026YTDtendervolumesto279.5GWh, up 200%YoY.Winning bid (award) battery volumes reached 42.4GWh, whichwas 20% YoY and 76%MoM. Outsideof China,U.S.EsSbattery installationsremained lower YoYaccording toEIAdata.MayU.S.ESSbatteryinstallationswere1.9GWh,down56%YoY.For2026YTDasawhole,U.S.ESSbatteryinstallationsreached11.9GWh,which wasdown24%YoY. German ESS installations continued to experience strong YoY growth in May,ledby large-scale storage deployment. Battery installations reached O.6GWh in May, up28% YoY, with large-scale storage contributing 0.2GWh (+271% YoY),industrial storagecontributing 0.042GWh (+33% YoY),and residential storage contributing 0.41GWh(+3%YoY).For2026YTD,GermanyESSbattery installations reached3.4GWh,up37%YoY. Record growth in energy storage deployment continued this month with monthly shipments reaching 97.8GWh which ismore than global EV sales.China demand is particularly strong driven byfalling costs in battery costs and a more supportivepolicy environment which makes the economics of energy storage more attractive. Year to date shipments in China reached406.9GWh, up 107% YoY and higher than our 86% estimated growth of global ESS shipments for the year, although weincreasing153% YoY to 54.9GWh, supporting a solid demand pipeline. While China dominates the storage market,internationaldemand is also accelerating.Germany showed strong growth, with battery installations up 28% YoY to 0.6Gwh, led by large-scale storageat 0.14GWh (+271% YoY).US installations appear surprisingly weak-56%YoY, with EIAdata showing lowshipment volumes in May.Among China batterymakers, CATL retained its leading position with21.0GWh of May ESS shipments(+75% YoY)and 22.4%YTD market share. CATL remains in our view the best way to play this theme. We rate CATLA-shareOutperformandCATLH-shareMarket-Perform. at installation, shipment and production,figures from multiple sources.The database is updated on a monthly basis with a one-month lag.The following note is divided into 6 sections: 1.ESSOVERVIEWMayChina ESSshipments reached97.8GWh,representing103%YoYand5%MoMgrowth.Utilization ratekeepto 94% in May,up from 73% in May 2025.China ESS tenders reached 54.9GWh, up 153% YoY, indicating a strong forwarddemand pipeline. U.S.ESSinstallations reached1.9GWh,down56%YoY. Germany ESS installations reached O.6GWh,up 28%YoY, supported bya strong rebound from February. EXHIBIT1:Global monthlydata of ESSJun-25Jul-25 2.CHINAESS0VERVIEW:2026YTDESSSHIPMENT407WH(107%YOY) MayChina ESS shipmentswere97.8GWh (103%YoY,5%MoM).Domestic shipments were100%YoYto94.5GWhChina ESS shipments reached 406.9GWh, 107%YoY.(Exhibit 2) During the month, CATLled the market with 21.0GWh(75% YoY,21.5% M/S), followed by EVE with 8.6GWh (56%YoY, 8.8% M/S), Hithium with 8.5GWh(54% YoY, 8.7% M/S), BYD with 7.5GWh(70% YoY, 7.7% M/S), and CALB with6.3GWh(55% YoY,6.2% M/S)(Exhibit3toExhibit 6) During the month,CORNEX recorded the highest YoY growth rate at 350% to7.2GWh,followed by Ganfeng at 247%21.0GWh. (Exhibit 5) EXHIBIT 6: China ESS top producers'shipment in 2026 maintain a high level.(Exhibit 8).:Duringthemonth,CATL(basedonICCestimates)ledthemarketwith56%YoYto20.8GWh(20.4%oftotal capacity, added 7.5GWh) followed by EVE with 51% YoY to 8.3GWh (8.2% of total capacity, added 1.8GWh), with Hithium 43%YoY to 8.3GWh (8.2% of total capacity,added 2.5GWh), BYD with 38% YoY to 7.5GWh (7.3%