EEMEA股票策略观察:我们知道您的邻国在做什么:应对新逆风
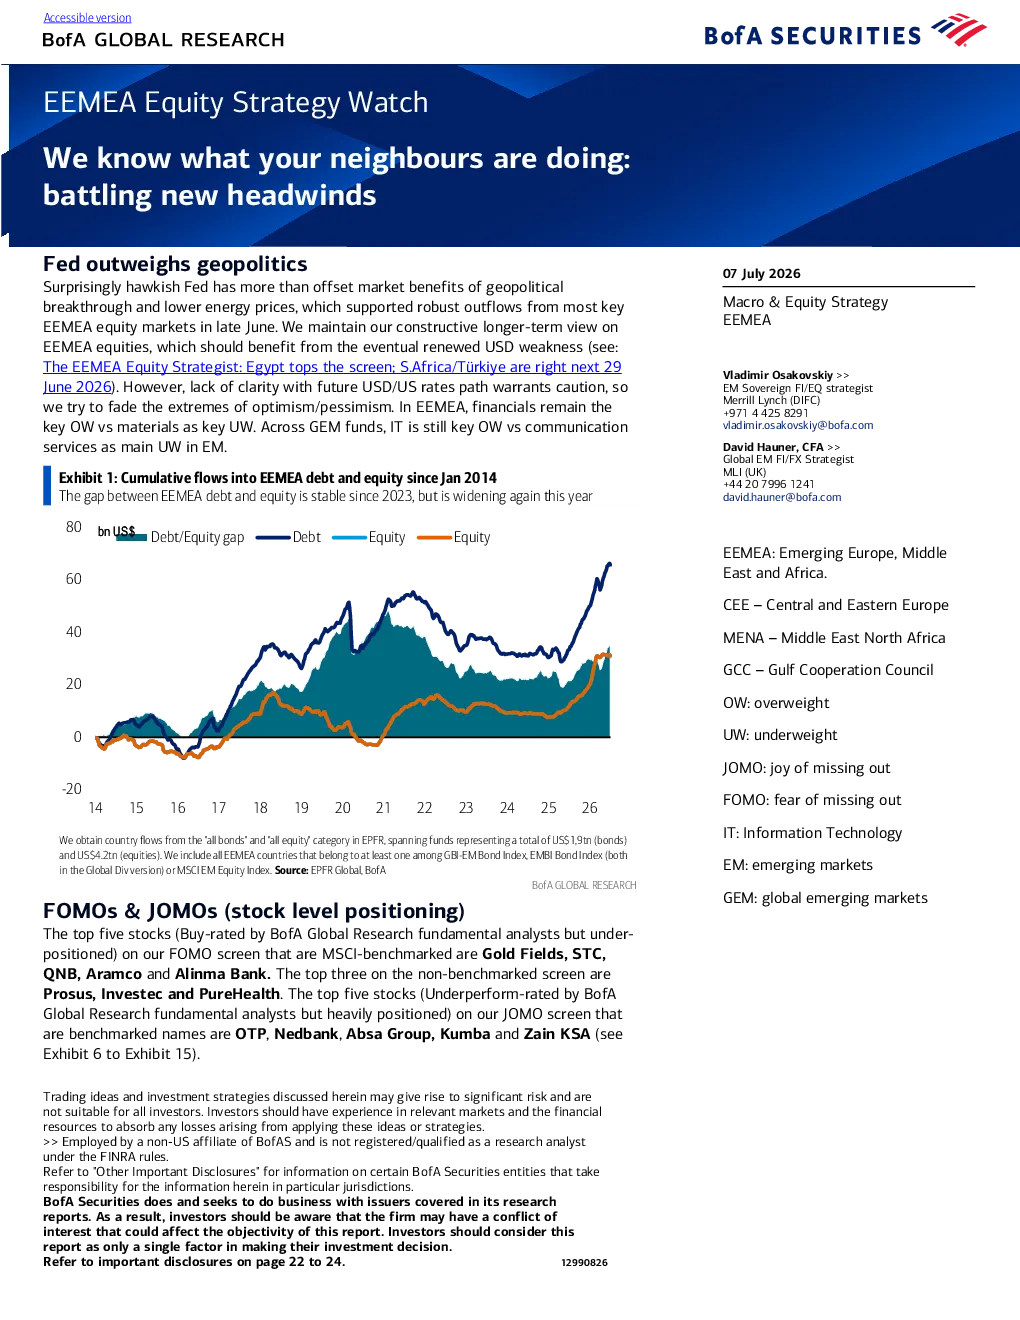
我们知道你的邻居们在应对新的逆风。 地缘政治难抵美联储影响令人惊讶地,美联储鹰派立场已超过地缘政治突破和能源价格下降对市场的利好作用 2026年7月7日 ,这支撑了6月下旬多数中东欧及亚洲主要股市的资金大幅流出。我们维持对中东欧及亚洲股市的积极长期看法,预计其将受益于美元最终重拾疲软(参见:中东欧及亚洲股票策略师:埃及位列首选;南非/土耳其紧随其后——2026年6月29日)。然而,未来美元/美国利率路径的不确定性需保持谨慎,因此我们试图淡化乐观/悲观的极端情绪。在中东欧及亚洲市场,金融股仍是主要看涨(Overweight, OW)板块,而材料股是主要看跌(Underweight, UW)板块。在GEM基金中,信息技术股仍是主要看涨(Overweight, OW)板块,而通信服务是主要看跌(Underweight, UW)板块。 宏观与股票策略 EEMEA vladimir.osakovskiy@bofa.com奥萨科夫斯基,弗拉基米尔>>EM主权固收/股票策略师美林(迪拜国际金融中心)+971 4 4258291 大卫·豪纳,CFA全球EM固定收益/外汇策略师MLI(英国) +4420 7996 1241 david.hauner@bofa.com 自2023年以来,EEMEA地区的债务与股权之间的差距一直保持稳定,但今年又开始扩大。 欧洲、中东和非洲新兴市场 CEE – 中东欧MENA – 中东和北非GCC – 海合会OW: 超重UW: 体重不足JOMO: 错失的喜悦FOMO: 错失恐惧IT: 信息技术EM: 新兴市场GEM: 全球新兴市场 错失恐惧症与拥有恐惧症(库存水平定位)我们FOMO筛选器中,按MSCI基准排名的前五只股票(由BofA全球研究基本面分析师给 予“买入”评级但配置不足)是:Gold Fields、STC、QNB、Aramco和Alinma Bank。非基准筛选器中排名前三是Prosus、Investec和PureHealth。我们JOMO筛选器中,按基准排名的前五只股票(由BofA全球研究基本面分析师给予“表现不佳”评级但配置权重高)是:OTP、Nedbank、Absa Group、Kumba和Zain KSA(参见附表6至附表15)。 请参阅“其他重要披露”以获取有关在特定司法管辖区承担此处信息责任的花旗证券某些实体的信息。 美国银行证券部门与其研究报告中涉及的公司进行业务往来,并寻求进行此类业务。因此,投资者应注意,该公司可能存在利益冲突,从而影响本报告的客观性。投资者应将本报告视为其投资决策的单一因素。请参阅第22至24页的重要披露信息。12990826 库存水平定位:FOMO与JOMO 展品2(错失恐惧症,FOMO)和展品3(喜悦共鸣,JOMO)筛选MSCI欧、亚、中东指数(EEMEA)成分股的定位排名。我们调整基金层面(包含基准股和非基准股)个股在MSCIEEMEA指数中的权重比例,以量化个股基准股的过度/不足加权程度。展品4(错失恐惧症,FOMO)和展品5(喜悦共鸣,JOMO)筛选非MSCI EEMEA指数成分股的定位排名。我们的筛选基于特定股票被GEM基金持有的百分比进行排序。 附件3:前十大JOMO(拥有量最高、表现不佳评级、按UW/OW排名)OTP银行在我们的JOMO筛选中排名第一 图4:前十大非基准FOMO(持有量最少、买入评级、按GEM基金占比排名) 普罗苏斯在我们的FOMO非基准筛选中排名第一。 我们基本面分析师将多数自有/持有股票评级为表现不佳。我们的投资组合基于152只活跃的全球新兴市场(GEM)基金,其MSCI新兴市场基准,资产管理规模(截至本月)为2,148.8亿美元。此筛选结果既非个股推荐,也非股票组合推荐,且可能与摩根大通的基本面观点不一致(若摩根大通覆盖该股票)。投资者应在做出任何投资决策前,考虑相关公司的基本面以及自身的具体情况/目标。来源:DataStream、FactSet、彭博、摩根大通全球研究 参见附件2中的说明。来源:DataStream、FactSet、彭博、美国银行全球研究美国银行全球研究 参见附件2中的说明。来源:DataStream、FactSet、彭博、美国银行全球研究美国银行全球研究 美国银行全球研究部 第16号证据和第17号证据列出了GEM基金持有的、属于MSCI EM指数的股票。这些股票被赋予一个定位排名(百分位排名),该排名是两个因素(百分位排名)的等权重平均值:OW/UW定位和GEM基金持有百分比。对于GEM基金持有但不在MSCI EM指数中的股票,由于只有一个因素,我们将GEM基金持有百分比的排名权重定为100%。第16号证据和第17号证据中的股票排名,与其是否被花旗基础分析员评级(花旗有相关股票覆盖)无关。 错失恐惧症与拥有恐惧症方法论 库存筛选 在股票层面,我们筛选MSCI新兴EMEA市场或花旗银行覆盖的11个EEMEA市场的股票。我们还需要过去3个月日均成交额至少为100万美元。由于数据可用性,部分筛选的股票数量可能较少。股票层面的头寸数据基于我们样本中的154只活跃GEM基金,其资产管理规模为2148.8亿美元,并采用MSCI基准。我们使用IBES一致预期估计,若不可用,则使用彭博估计。 图2(错失恐惧症)和图3(喜悦共鸣症)展示了MSCI EEMEA指数成分股的定位排名。我们通过在基金层面(包含基准股票和非基准股票)调整MSCI EEMEA个股与其他MSCI EEMEA个股的权重比例,以量化单个基准股票的过度加权/不足加权程度。 图4(错失恐惧症)和图5(喜悦共鸣症)展示了MSCI欧、亚、中东及非洲指数(EEMEA)非成分股的定位排名。我们根据特定股票被GEM基金持有的百分比对这些股票进行排名。 第16号证据和第17号证据列出了GEM基金持有的、属于MSCI EM指数的股票。这些股票被赋予一个定位排名(百分位排名),该排名是两个因素(百分位排名)的等权重平均值:OW/UW定位和GEM基金持有百分比。对于GEM基金持有但不在MSCI EM指数中的股票,由于只有一个因素,我们将GEM基金持有百分比的排名权重定为100%。第16号证据和第17号证据中的股票排名,与其是否被花旗基础分析员评级(花旗有相关股票覆盖)无关。 市场筛选 我们的屏幕涵盖了MSCI新兴市场中的11个EEMEA市场,具体包括:土耳其、南非、波兰、匈牙利、捷克共和国、希腊、阿联酋、卡塔尔、埃及、沙特阿拉伯和科威特。 市场层面的定位数据来源于EPFR Global。对于截至12月底的数据,EPFR样本基于152只具有MSCI新兴市场(GEM)基准的活跃全球新兴市场(GEM)基金,其资产管理规模(AUM)为2148.8亿美元,占1098只基金总资产管理规模9377亿美元的比重。希腊自2013年起、阿联酋和卡塔尔自2014年起、沙特自2019年起、科威特自2020年起以及其余国家自2012年起的数据为平均值。来源:EPFR、DataStream、BofA全球研究。 自上而下的流动 附件19:中东欧及中亚地区股票基金资金流动欧洲、中东和非洲地区(EEMEA)近期资金流入。 花旗全球研究,EPFR全球 欧洲、中东和非洲地区(EEMEA)上周出现了资金流出。 附件23:EEMEA地区最拥挤和最不拥挤的行业财务领域是风险敞口(最高和范围)最大的,而公用事业领域则保持低配置,尽管鉴于该 行业的规模,许多基金对其仍有一定程度的敞口。 中东欧、中东和非洲地区行业定位:增加房地产,削减金融和消费行业 附件24:GEM基金对新兴市场及欧洲、中东和非洲(EEMEA)行业板块的配置与MSCI EEMEA的比较财务是EEMEA地区最大的OW部门。 国家定位:EEMEA 仍主要处于 UW 阶段 附件27:GEM基金定位与MSCI EEMEA市场匈牙利是最大的OW,其次是希腊和土耳其。 美国银行全球研究部 全球EM领域定位 图35:GEM基金定位——近期OW/UW与MSCI EM的变化 第34项证据:GEM基金定位与MSCI EM(OW/UW,以百分比点计)能源与工业 - 与历史平均水平相比,OW占比最高 过去六个月中,通信服务领域的定位提升最为显著。 截至十二月底的数据显示,EPFR样本基于152只活跃的全球新兴市场(GEM)基金,其MSCI新兴市场基准,管理资产规模(AUM)为2148.8亿美元,占全部1090只基金、9999.38亿美元AUM的比重。自2013年以来,希腊、2014年以来,阿联酋和卡塔尔平均数据。 附件43:GEM基金在信息技术领域与MSCI EM的定位对比 附录 披露 重要披露 基本面评级关键:评级包括波动风险评级、投资评级和收益评级。波动风险评级是衡量潜在价格波动的指标,分为:A-低,B-中,C-高。投资评级反映分析师对股票绝对总回报潜力的评估,以及相对于其覆盖板块(定义见下文)内其他股票的投资吸引力。我们的投资评级分为: 潜在现金股息的指标为:7-相同/较高(股息被认为安全),8-相同/较低(股息被认为不安全)。收入评级由以下股票组成:由单一分析师覆盖的股票,或两位或多位分析师共享相同行业、部门、覆盖集群区域或其他分类的股票,或9-不支付现金股息。一只股票的覆盖集群包含在最新一份引用该股票的BofA全球研究报告内。 美国银行全球研究部人员(包括负责本报告的分析师)的薪酬基于多种因素,其中包括美国银行公司整体的盈利能力,包括其投资银行业务产生的利润。负责本报告的分析师的薪酬也可能基于多种因素,其中包括与该分析师负责的证券或金融工具类别相关的美国银行销售和交易业务的整体盈利能力。 其他重要披露 价格仅供参考。除非报告中另有说明,否则就任何与股票相关的建议而言,所参考的价格是指报告日前闭市时该证券的公开交易价格;如果报告是在盘中发布,则所参考的价格是指报告日及时间的交易价格。就债务证券(包括优先股和CDS)而言,价格是指报告日及时间的参考价格,并来自包括美国银行证券交易台在内的多个来源。 本报告中任何建议的生产完成日期和时间应为本报告传播日期和时间,即报告时间戳中记录的日期和时间。 本报告可能涉及某些固定收益证券或其他金融工具,这些证券或金融工具可能在一个或多个州或司法管辖区内未被提供或销售,或涉及特定类别的投资者,包括零售投资者。本报告的读者应注意,其中对任何此类工具的讨论、建议或其他提及均不构成买卖此类工具的邀约或要约。投资者应就此类工具的相关信息联系其美国银行证券代表或美林全球财富管理财务顾问。非机构投资者或市场专业人士的接收者,在考虑本报告中与任何投资决策相关的信息,或需要对其内容进行必要解释时,应寻求其独立财务顾问的建议。 BofAS的官员或其一个或多个附属机构(不包括研究分析师)可能对发行人的证券或相关投资拥有经济利益。被认定为经济学家的个人在美国法律下不履行研究分析师的职能,他们准备的报告在美国适用的法规下也不被视为研究报告。宏观经济分析根据金融行为管理局的规则,在英国分发目的下被视为投资研究。. 参考BofA全球研究关于利益冲突的政策。 "美国银行证券"包括美国银行证券公司("美国银行证券")及其附属机构。若投资者对本报告内容或本报告中所述任何投资建议是否适合该投资者有疑问,应联系其美国银行证券代表或美林全球财富管理财务顾问。"美国银行证券"是美国银行全球研究的一个全球品牌。 花旗证券及附属研究报告分发有关非美国附属机构的信息:BofAS和/或美林证券(Merrill Lynch, Pierce, Fenner & Smith Incorporated,简称MLPF&S)未来可能在美国分发以下非美国附属机构的信息(简称:法律名称,监管机构) : 美林证券(南非):美林证券南非私人有限公司(Merrill Lynch South Africa (Pty) Ltd.),受金融行业行为监管局(Financial Sec