勘探与生产业务现状 2026年第一季度:洞悉系统内在的油价弹性
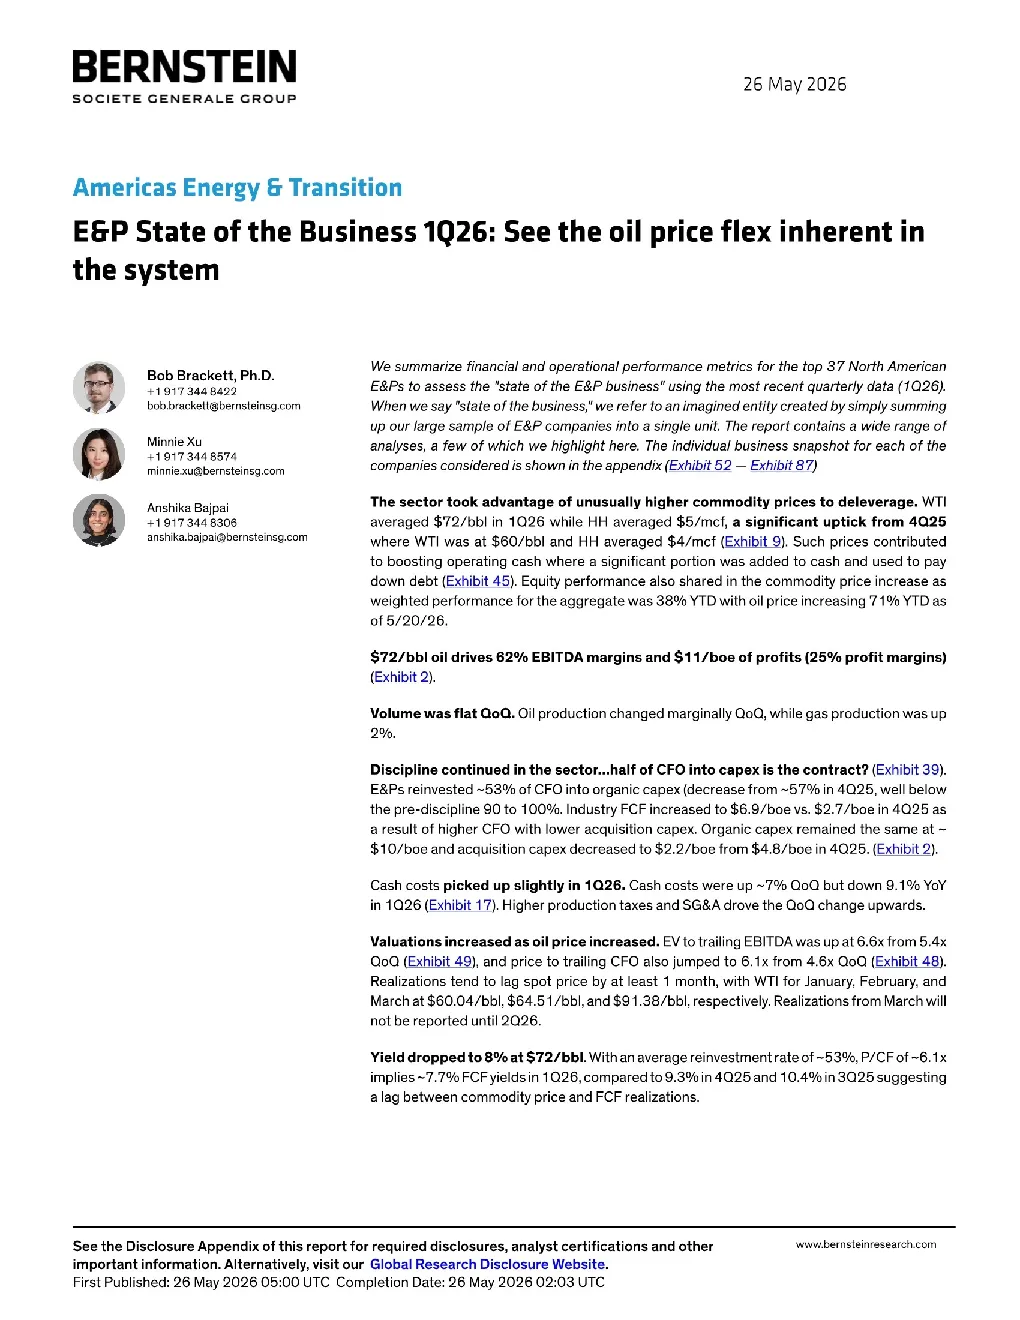
E&P State of the Business 1026: See the oil price flex inherent inthe system E&Ps toassess the"state of the E&Pbusiness"usingthemost recentquarterly data (1Q26)upour large sampleof E&P companies into a single unit.Thereport contains a widerange ofanalyses, a few of whichwe highlight here.The individual business snapshot for each of thecompanies considered is shown in theappendix (Exhibit52-Exhibit 87) +19173448422bob.brackett@bernsteinsg.com +1917344 8574minnie.xu@bernsteinsg.com averaged $72/bbl in1Q26while HHaveraged $5/mcf,a significantuptick from4Q25where WTI was at $60/bbl and HH averaged $4/mcf (Exhibit 9). Such prices contributedto boosting operating cash where a significant portion was added to cash andused to paydown debt (Exhibit 45).Equity performance also shared in the commodity price increase asweightedperformanceforthe aggregatewas 38%YTDwithoilprice increasing71%YTDasof5/20/26. +19173448306anshika.bajpai@bernsteinsg.com $72/bbloildrives 62%EBITDAmargins and$11/boeof profits (25%profitmargins)(Exhibit 2). Volume wasflat QoQ. Oil production changed marginally QoQ, while gas production was up2%. Discipline continued inthe sector...half of CFO into capex is the contract? (Exhibit 39)E&Psreinvested~53%ofCF0intoorganiccapex(decreasefrom~57% in4Q25,wellbelowthe pre-discipline 90 to 100%.Industry FCF increased to $6.9/boe vs.$2.7/boe in 4Q25 asa result of higher CFO with lower acquisition capex. Organic capex remained the same at ~$10/boeandacquisitioncapexdecreasedto$2.2/boe from$4.8/boe in4Q25.(Exhibit 2). Cash costs picked up slightly in1Q26.Cash costs were up~7% QoQ but down 9.1% YoYin 1Q26 (Exhibit 17).Higher production taxes and SG&AdrovetheQoQchangeupwards. Valuations increasedas oilpriceincreased.EVtotrailing EBITDAwasupat6.6xfrom5.4xQoQ (Exhibit 49), and price to trailing CFO also jumped to 6.1x from 4.6x QoQ (Exhibit 48),Realizations tend to lag spot price by at least 1 month, with WTI for January, February, andMarchat$60.04/bbl,$64.51/bbl,and$91.38/bbl,respectively.RealizationsfromMarchwilnotbereporteduntil2Q26 Yielddroppedto8%at$72/bbl.Withanaveragereinvestmentrateof~53%,P/CFof~6.1ximplies~7.7%FCFyieldsin1Q26,comparedto9.3%in4Q25and10.4%in3Q25suggestingalagbetweencommoditypriceandFCFrealizations. names suchasFANGand COP. In this report, we use a large database of financial and operational performance measures for 37 E&Ps. We work through key drivers of performancefrom both a cash flow and income-focusedview.The report is organized bykey variables and evaluatestrends over (a)time, (b) company size, (c)productfocus (oil versus gas),and (d) stock performance. Thetable of contents belowshowsthe organization.The Appendix provides details aboutthecompanies considered. Shaded green=oilycoverage PRIMARYDRIVERSOFE&PECONOMICS Weuse a visual waterfall to identifythe key drivers of E&P economics (Exhibit 2,Exhibit 3, Exhibit 4) over three timehorizons(1Q26,4Q25andthelastfourquarters,respectively) The production-weightedaverages shown in the exhibits are derived from 37E&P companies (Exhibit 50 inthe Appendix spellsout the included names).We divide companies into categories along two lines:we split oily and gassy E&Ps using a cutoffof50%oil,andwesplitlargecapandsmall capcompaniesusingacutoffof$5billionmarketcap (note,as of3/31/2026,27E&Ps qualified as large-cap - COP, CNQ, SU, EOG, OXY, IMO, FANG, CVE, EQT, DVN, CTRA, EXE, TOU, PR, OVV, ARX, APA, AR,RRC, CHRD,MTDR, SM, CRK, CRC, MGY,MUR, and CNX.) Before proceeding, we introduce definitions of the terms discussed through the report. Expected revenue istheproductof acompany'sproductionforthequartertimes theblended expected price oftheirproduct. For expected oil price, we use WTI.For expected gas price, we use HH.Blending is based simply on the proportion of oil/gasreported.NGLs are considered liquids and included as oil. oiland gas production,and production taxes. stateto state. costs. productioncosts,productiontaxes,explorationexpenses andSG&A. DD&A is Depreciation, depletion and amortization as reported by the companies. EBITis EBITDAless the DD&A. Interestcosts are interestpayments on debt borrowed net of interest received. FinancialTaxes aretax expensescalculatedatauniform35%taxrate onprofitbeforetax forallthecompanies used in theanalysis till 2017.From 2018, wetake 21%uniform tax ratefor the companies. CleanNetIncomeisderivedasEBlTlessInterestandFinancialtaxes.Notethatimpairmentsandotherexpenseswhichareone-time/extraordinary in nature are not considered in Clean Net Income calculation Otherarenon-cash expenseswhichgenerally includeofimpairments,deferredtaxes,sharebased compensations,workingcapital changes,income/loss fromdiscontinuedoperations,etc. CashflowfromOperations isthecashgeneratedbytheoperating activitiesof thebusiness. Total Capex isthe capital expenditure incurred on explorationand developmentassets and includes the amount spentonmergers/acquisitionofnewcompanies/properties. OrganicCapexisthe capital ex