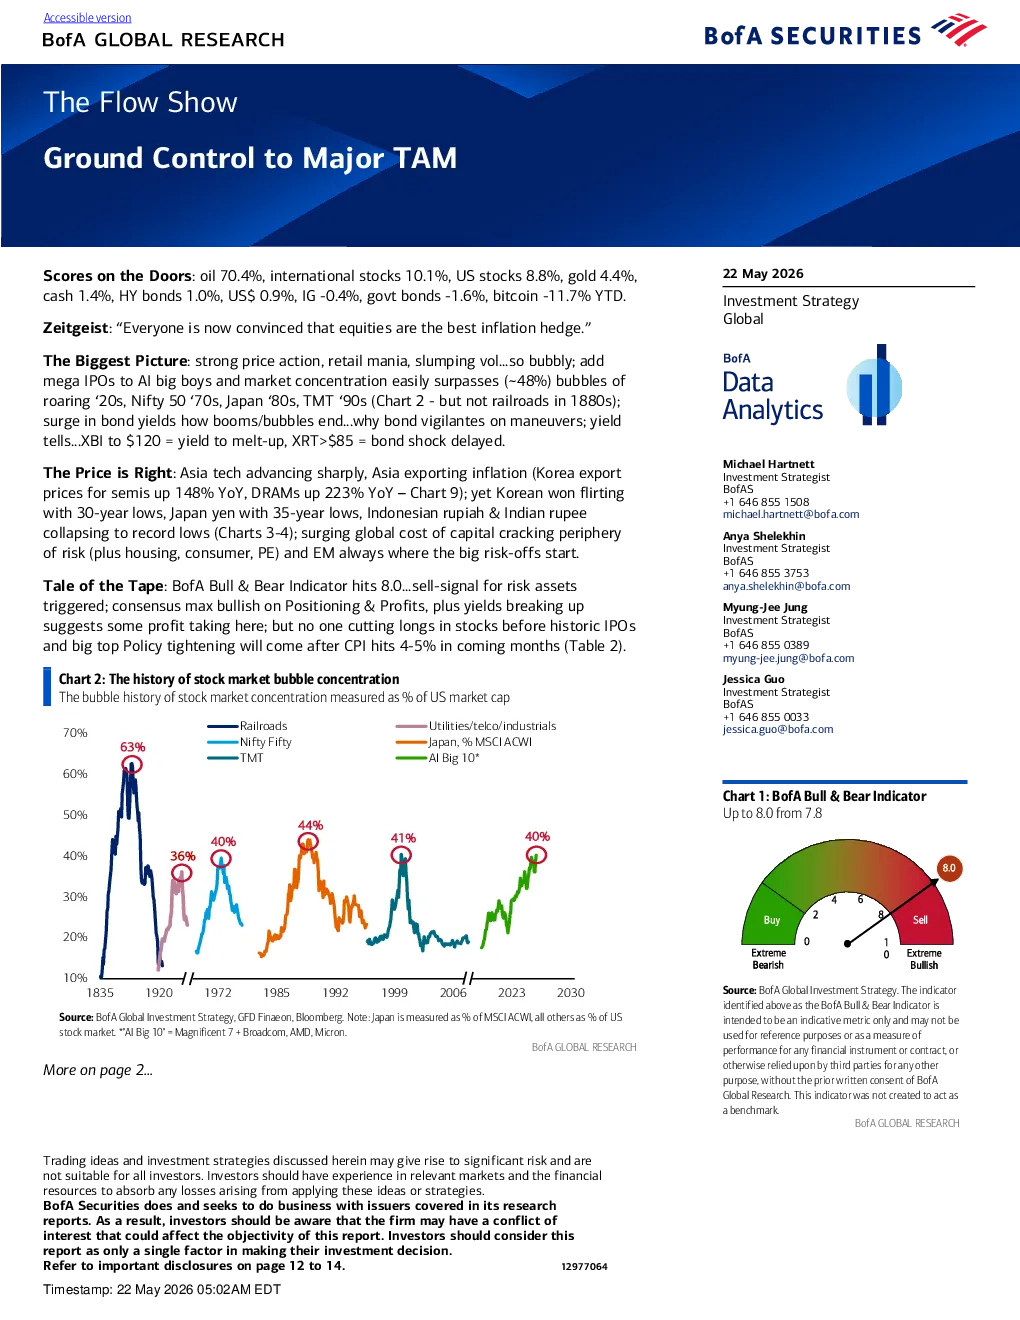
Ground Control to Major TAM 22 May 2026 Scores on the Doors: oil 70.4%, international stocks 10.1%, US stocks 8.8%, gold 4.4%,cash 1.4%, HY bonds 1.0%, US$ 0.9%, IG -0.4%, govt bonds -1.6%, bitcoin -11.7% YTD. Investment StrategyGlobal Zeitgeist:“Everyone is now convinced that equities are the best inflation hedge.” The Biggest Picture: strong price action, retail mania, slumping vol...so bubbly; addmega IPOs to AI big boys and market concentration easily surpasses (~48%) bubbles ofroaring‘20s, Nifty 50‘70s, Japan‘80s, TMT‘90s (Chart 2 - but not railroads in 1880s);surge in bond yields how booms/bubbles end...why bond vigilantes on maneuvers; yieldtells...XBI to $120 = yield to melt-up, XRT>$85 = bond shock delayed. MichaelHartnettInvestment StrategistBofAS+1 646 855 1508michael.hartnett@bofa.com The Price is Right: Asia tech advancing sharply, Asia exporting inflation (Korea exportprices for semis up 148% YoY, DRAMs up 223% YoY–Chart 9); yet Korean won flirtingwith 30-year lows, Japan yen with 35-year lows, Indonesian rupiah & Indian rupeecollapsing to record lows (Charts 3-4); surging global cost of capital cracking peripheryof risk (plus housing, consumer, PE) and EM always where the big risk-offs start. Anya ShelekhinInvestment StrategistBofAS+1 646 855 3753anya.shelekhin@bofa.com Tale of the Tape: BofA Bull & Bear Indicator hits 8.0...sell-signal for risk assetstriggered; consensus max bullish on Positioning & Profits, plus yields breaking upsuggests some profit taking here; but no one cutting longs in stocks before historic IPOsand big top Policy tightening will come after CPI hits 4-5% in coming months (Table 2). Myung-Jee JungInvestment StrategistBofAS+1 646 855 0389myung-jee.jung@bofa.com Jessica GuoInvestment StrategistBofAS+1 646 855 0033jessica.guo@bofa.com The bubble history of stock market concentrationmeasured as% of US market cap Source:BofA Global Investment Strategy. The indicatoridentified above as the BofA Bull & Bear Indicator isintended to be an indicative metric only and may not beused for reference purposes or as a measure ofperformance for any financial instrument or contract, orotherwise relied upon by third parties for any otherpurpose, without the prior written consent of BofAGlobal Research. This indicator was not created to act asa benchmark.BofA GLOBAL RESEARCH More on page 2… Tradingideas and investment strategies discussed herein may give rise to significant risk and arenot suitable for all investors. Investors should have experience in relevant markets and the financialresources to absorb any losses arising from applying these ideas or strategies.BofA Securities does and seeks to do business with issuers covered in its researchreports. As a result, investors should be aware that the firm may have a conflict ofinterest that could affect the objectivity of this report. Investors should consider thisreport as only a single factor in making their investment decision.Refer to important disclosures on page 12 to 14.12977064 Timestamp: 22 May 2026 05:02AM EDT Weekly Flows: $30.5bn to bonds, $2.4bn to stocks, $1.2bn to cash, $1.1bn from gold,$1.5bn from crypto. Flows to Know: •Crypto: $1.5bn outflow, biggest since Feb'26,•Treasuries: $10.8bn inflow, biggest in 9 weeks,•US equities: $9.5bn inflow, 8 weeks of inflows, longest streak since Dec’25,•Europe: $2.3bn outflow, 6 weeks of outflows, longest streak since Feb'25 (Chart 10),•EM equities: $7.9bn outflow, 6 weeks of outflows, longest streak since Nov'24(Chart 11),•Tech: $9.0bn inflow, biggest since Oct'25 (Chart 12),•Financials: $2.4bn outflow, biggest in 10 weeks,•Materials: $2.9bn outflow, biggest in 8 weeks. BofA Private Clients: $4.5tn AUM…65.7% stocks (record high), 17.3% bonds (lowestsince Mar’22), 9.9% cash (record low); largest weekly inflow to cash since Dec’25($4.1bn); GWIM increasing equity exposure (ETF share count up 4.4% YTD); note BofAprivate client cumulative inflow to T-bills down since peak 3-month yield in Dec'23(Chart 5), and higher 10-year yield needed to spur greater flows to bonds (Chart 6); past4 weeks private clients buying muni bonds, materials, HY vs selling low vol, utilities,REITs. BofA Bull & Bear Indicator1: up to 8.0, triggering contrarian sell signal for risk assets,on tech/EM debt inflows + record monthly jump in FMS equity allocation + drop in FMScash levels to 3.9%; there have been 17 “sell signals” since ’02, average loss for globalstocks over 2-3 months is 2-3% (hit ratio of ~60%), with max drawdowns of 15-20%;seeBofA Bull & Bear Indicator Revampfor full backtest results. A Short History of IPOs: Table 1 shows price action in broad indices after top 10 IPOlaunches of all time; Alibaba and ICBC IPOs were “rocket fuel” for Chinese equities infollowing 3-12 months; NTT & ENEL were timed before big bear markets but big bearbegan a year later; in contrast, Visa & AIA were“toppy”IPOs, with SPX & Hang Sengmuch lower 9-12 months after launch; Aramco, Softbank, Facebook, GM launch