钢铁关税提高至50%,略有压力;不利因素仍然温和
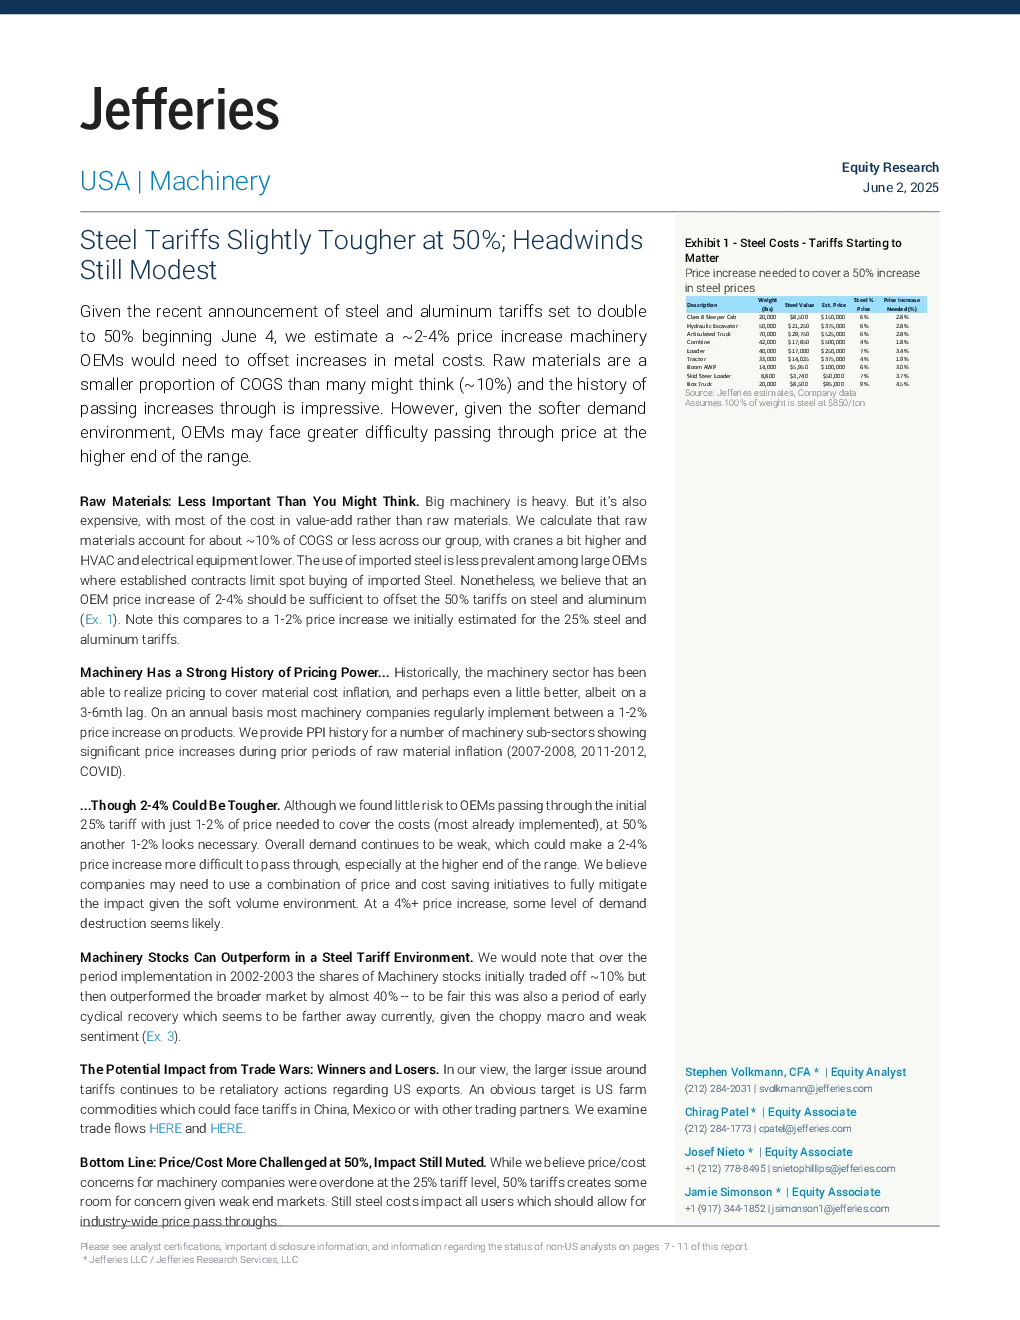
Stephen Volkmann, CFA * | Equity Analyst(212) 284-2031 | svolkmann@jefferies.comChirag Patel * | Equity Associate(212) 284-1773 | cpatel@jefferies.comJosef Nieto * | Equity Associate+1 (212) 778-8495 | snietophillips@jefferies.comJamie Simonson * | Equity Associate+1 (917) 344-1852 | jsimonson1@jefferies.comExhibit 1 - Steel Costs - Tariffs Starting toMatterPrice increase needed to cover a 50% increasein steel prices.DescriptionWeight(lbs)Steel ValueEst. PriceSteel %PricePrice IncreaseNeeded (%)Class 8 Sleeper Cab20,000$8,500$150,0006%2.8%Hydraulic Excavator50,000$21,250$375,0006%2.8%Articulated Truck70,000$29,750$525,0006%2.8%Combine42,000$17,850$500,0004%1.8%Loader40,000$17,000$250,0007%3.4%Tractor33,000$14,025$375,0004%1.9%Boom AWP14,000$5,950$100,0006%3.0%Skid Steer Loader8,800$3,740$50,0007%3.7%Box Truck20,000$8,500$95,0009%4.5%Source: Jefferies estimates, Company dataAssumes 100% of weight is steel at $850/ton MachineryEquity ResearchJune 2, 20252 Exhibit 2 - Steel Costs - Tariffs Starting to MatterPrice increase needed to cover a 50% increase in steel prices.DescriptionClass 8 Sleeper CabHydraulic ExcavatorArticulated TruckCombineLoaderTractorBoom AWPSkid Steer LoaderBox TruckSource: Jefferies estimates, Company dataAssumes 100% of weight is steel at $850/tonExhibit 3 - Strong Relative Outperformance Under the Bush Tariff Policy.7090110130150170190Relative Share PerformanceSource: FactSet, JefferiesNote: 10-30% Tariff announced in March 2002 for 3-yr period (actually ended in Nov 2003)Exhibit 4 - Relative Machinery Performance Lagged Under Trump's Prior Tariff Period.707580859095100105Relative Share PerformanceSource: FactSet, JefferiesNote: 25% Steel Tariff announced in March 2018Please see important disclosure information on pages 7 - 11 of this report.This report is intended for Jefferies clients only. Unauthorized distribution is prohibited. We estimate Steel makes up ~10% or less ofCOGS for most machinery equipment types; a~2-4% increase should be sufficient to passthrough a 50% increase in steel costs.3 Capital Goods: Generally Have Pricing Power - ButThere's a LimitBelow we show the Producer Price Index history for a broad range of machinery end markets in theUS. Our overall takeaway is that machinery markets tend to have solid 2-4% annual pricing power, orhigher, during past periods of commodity price inflation. A few key points:•Not our first rodeo.Crude materials prices saw periods of meaningful inflation in 2002-05,2007-09 and 2010-11. During each of these periods overall capital goods pricing in the USaveraged +2-4% (the same increase needed to offset tariff costs), with certain of our endmarkets even better.•Pass through has been sticky.Crude materials tend to be volatile over time, showing periodsof both strong inflation and deflation. At the same time, Machinery end market pricing trendstend to be nearly always positive to a greater or lesser degree over the last 15 years, which mayhelp to explain the general positive trend in machinery margins over the past decade.•But there is a lag.While the ability of machinery companies to pass through materials is good,we note in most end markets there is historically a lag of a quarter or two between the inflectionin materials and end product pricing.•Remember: Machinery is a global business.Every company in our coverage tends to try tobalance production and sales by region, as do most global competitors. This suggests theactual impact of tariff increases should be significantly more modest than the headline 25% forSteel and Aluminum.•Stronger dollar headwinds fade.The dollar started the year a headwind for most US companieswith corporate with international exposure expecting FX a 1-3% headwind to top-line growth in2025. The trend has since reversed with the dollar expected to be neutral for the year, easingwhat would have been another challenge to price increases previously.Exhibit 5 - Mining Machinery and Equipment Prices (% y/y chg).-25%-15%-5%5%15%25%Jan-02Jan-03Jan-04Mining Machinery Prices (%chg YoY)Source: Jefferies, Bureau of Labor StatisticsPlease see important disclosure information on pages 7 - 11 of this report.This report is intended for Jefferies clients only. Unauthorized distribution is prohibited. -60%-40%-20%0%20%40%60%80%Jan-05Jan-06Jan-07Jan-08Jan-09Jan-10Jan-11Jan-12Jan-13Jan-14Jan-15Jan-16Jan-17Jan-18Jan-19Jan-20Jan-21Jan-22Jan-23Jan-24Jan-25PPI: Mining Machinery and Equipment (NSA, 1982=100)PPI: Crude Materials (NSA, 1982=100) PPI: Crude Materials (%chg YoY) Exhibit 6 - Ag Machinery and Equipment Prices (% y/y chg).-20%-15%-10%-5%0%5%10%15%20%Jan-02Jan-03Jan-04Ag Equipment Prices (%chg YoY)Source: Jefferies, Bureau of Labor StatisticsExhibit 7 - Construction Equipment Prices (% y/y chg).-15%-10%-5%0%5%10%15%Jan-02Jan-03Construction Machinery Prices (%chgYoY)Source: Jefferies, Bureau of Labor StatisticsExhibit 8 - HVAC Equipment Prices (% y/y chg).-15%-10%-5%0%5%10%15%20%25%30%Jan-02Jan-03Jan-04HVAC Equipment Prices