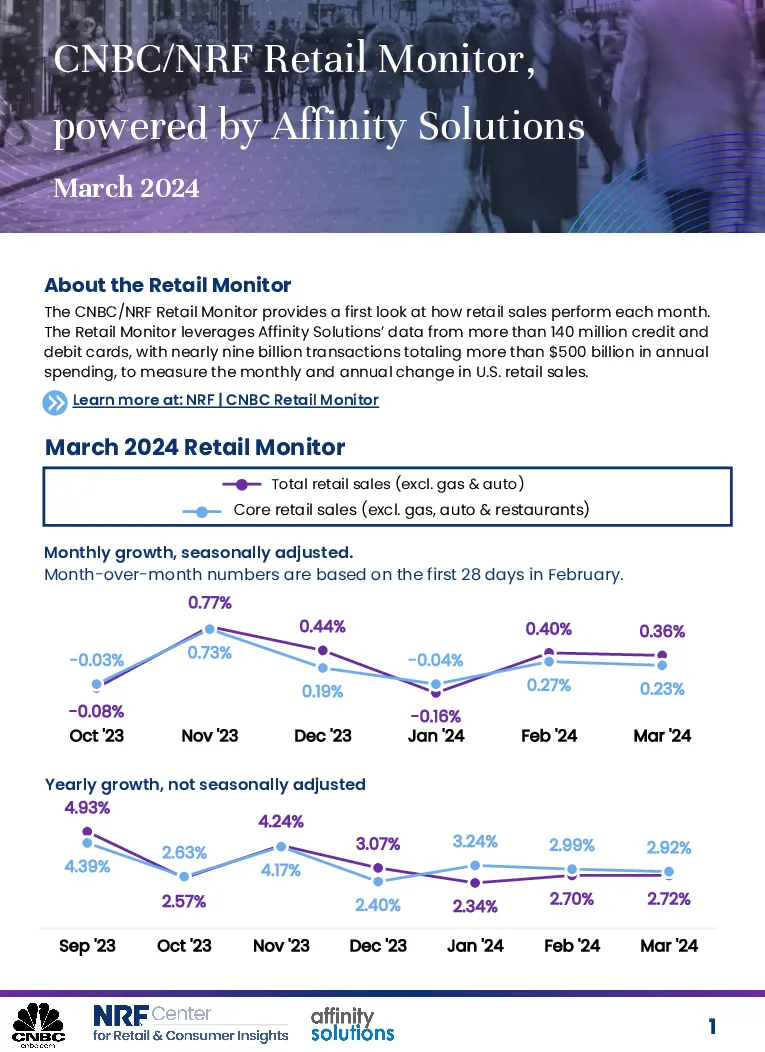
The CNBC/NRF Retail Monitor, powered by Affinity Solutions, provides a monthly analysis of U.S. retail sales performance using data from over 140 million credit and debit card transactions, totaling nearly nine billion transactions and $500 billion in annual spending. The monitor offers both monthly and annual growth rates for total retail sales (excluding gas and auto) and core retail sales (excluding gas, auto, and restaurants), and breaks down performance across various sectors.
Key Data and Trends:
- Monthly Growth (Seasonally Adjusted):
- Total retail sales (excl. gas & auto): March 2024 saw a slight decline of -0.16%, following growth in January and February.
- Core retail sales (excl. gas, auto & restaurants): Improved from -0.04% in February to 0.27% in March.
- Yearly Growth (Not Seasonally Adjusted):
- Total retail sales (excl. auto and gas): Continued growth, reaching 2.72% in March.
- Core retail sales: Steadily rose to 2.92% in March.
- Sector Performance:
- Furniture & Home Furnishings: Declined significantly, with year-over-year changes of -6.35% in January, -5.01% in February, and -5.28% in March.
- Electronics & Appliances: Showed mixed results, with January and February showing slight growth but a decline of -5.92% in March.
- Grocery & Beverage: Consistently strong growth, with year-over-year changes of 4.06% in January, 1.91% in February, and 4.22% in March.
- Health & Personal Care: Maintained high growth, though it slowed from 9.66% in January to 4.5% in March.
- Clothing & Accessories: Experienced steady growth, from 5.90% in January to 2.13% in March.
- Sporting Goods, Hobby, Music & Book Stores: Strong performance, with year-over-year changes of 1.79% in January, 9.67% in February, and 8.33% in March.
- Non-store Retailers: Continued robust growth, with year-over-year changes of 25.47% in January, 13.04% in February, and 15.47% in March.
- Food Services & Drinking Places: Improved from -1.54% in January to 1.91% in March.
Methodology and Accuracy:
The Retail Monitor uses Affinity Solutions’ Comet™ platform, analyzing anonymized and aggregated transaction data from over 140 million credit and debit cards. The methodology aligns with the U.S. Census Bureau’s seasonalization approach, showing a correlation of over 98% with revised retail sales data. Unlike the Census Bureau’s MRTS, which undergoes multiple revisions, the Retail Monitor provides a timely and final snapshot of retail health.
Comparison with U.S. Census Bureau’s MRTS:
While the MRTS relies on surveys of a subset of businesses and is subject to revisions, the Retail Monitor leverages high-frequency transaction data for near real-time insights. This approach better captures the modern retail landscape, including the shift toward non-store retailers and the blending of traditional and digital channels.