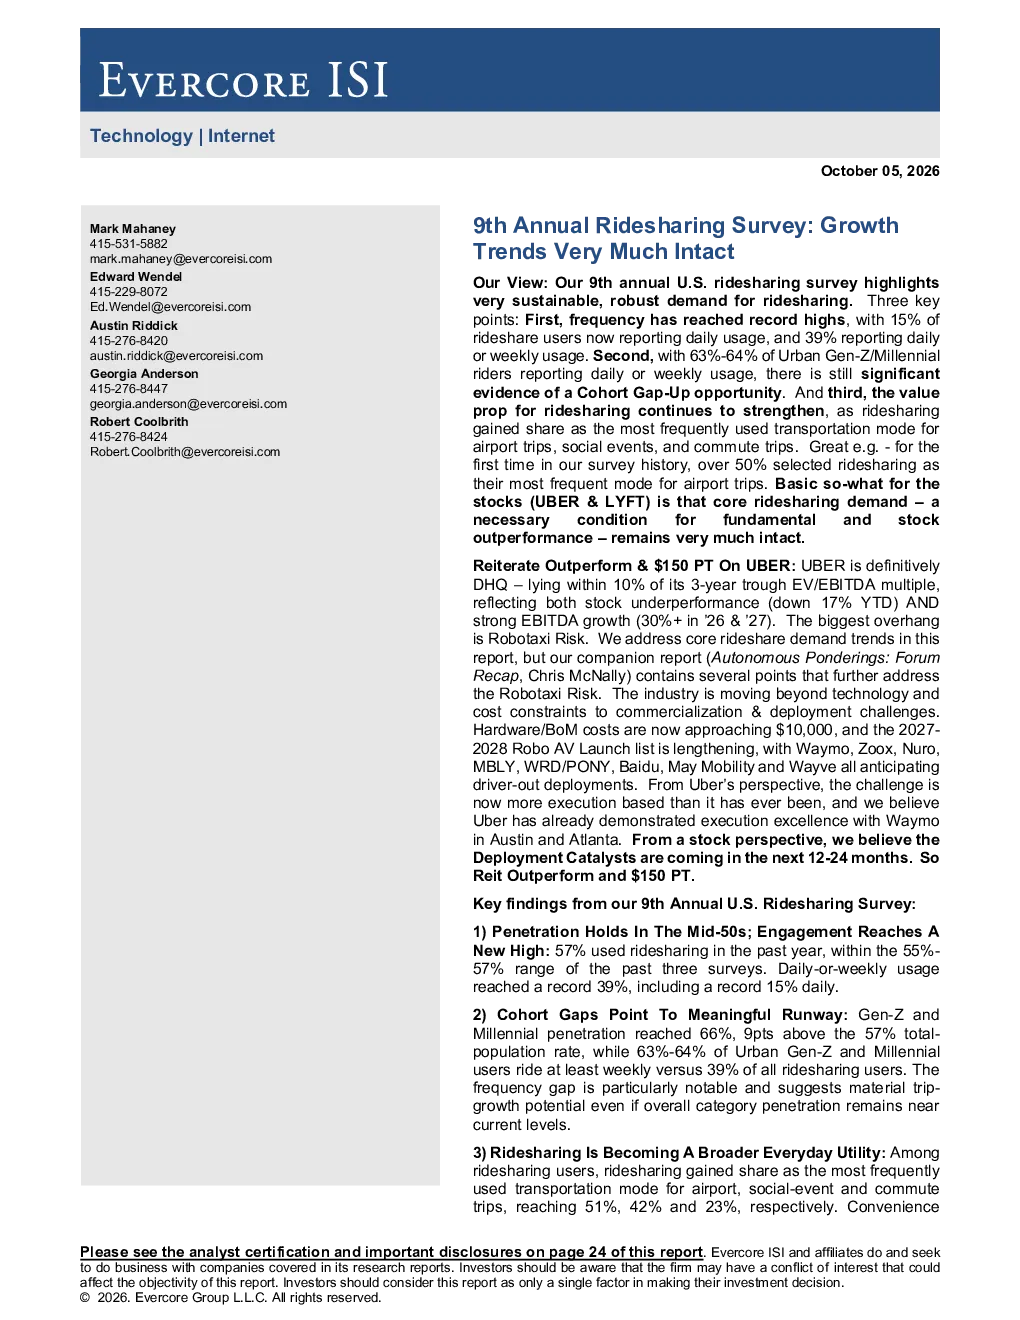
Our 9th annual U.S. ridesharing survey highlights very sustainable, robust demand for ridesharing. Three key points: First, frequency has reached record highs, with 15% of rideshare users now reporting daily usage, and 39% reporting daily or weekly usage. Second, with 63%-64% of Urban Gen-Z/Millennial riders reporting daily or weekly usage, there is still significant evidence of a Cohort Gap-Up opportunity. And third, the value prop for ridesharing continues to strengthen, as ridesharing gained share as the most frequently used transportation mode for airport trips, social events, and commute trips. Great example - for the first time in our survey history, over 50% selected ridesharing as their most frequent mode for airport trips. Basicso-what for the stocks (UBER & LYFT) is that core ridesharing demand – an necessary condition for fundamental and stock outperformance – remains very much intact.
Key findings from our 9th Annual U.S. Ridesharing Survey:
- Penetration Holds In The Mid-50s; Engagement Reaches ANew High: 57% used ridesharing in the past year, within the 55%-57% range of the past three surveys. Daily-or-weekly usage reached a record 39%, including a record 15% daily.
- Cohort Gaps Point To Meaningful Runway: Gen-Z and Millennials penetration reached 66%, 9pts above the 57% total-population rate, while 63%-64% of Urban Gen-Z and Millennial users ride at least weekly versus 39% of all ridesharing users. The frequency gap is particularly notable and suggests material trip-growth potential even if overall category penetration remains near current levels.
- Ridesharing Is Becoming A Broader Everyday Utility: Among ridesharing users, ridesharing gained share as the most frequently used transportation mode for airport, social-event and commute trips, reaching 51%, 42% and 23%, respectively. Convenience reached a record 50%, while 62% would use ridesharing the same following a $1 price increase.
- Uber And Lyft Results Are Positive, Especially So For Uber: Uber selection was 91% and Lyft was 60%. Uber reached recordsatisfaction and frequencyscores, while both platforms posted their strongest usage intentions in five years.
- Waymo Trial Moderates, But User Appeal Remains High: 26% of ridesharing users reported taking a Waymo over the last 12 months, down from 30% last year but above 21% in 2024. Among Waymo users, 74% would pay more and 72% would wait longer (down 5-6pts Y/Y), while availability remained the primary barrier for non-users.
Uber And Lyft Results Are Positive, Especially So For Uber:
Uber selection rose 2pts to 91%. It remains within the high-80s to low-90s range seen across the survey history, suggesting its broad U.S. footprint remains durable. Lyft selection fell 5pts to 60%. It remains within its broad historical range. The decline in reach alongside improved satisfaction is consistent with differences in usage breadth or consideration rather than service quality, although the survey does not establish the cause.
SatisfactionLevelsImprove For Both Services, With UBER Reaching Record High:
75% of Uber users and 73% of Lyft users were extremely or very satisfied. Uber reached a record high, while Lyft posted its highest result since 2019 and sharply reversed last year’s weakness. Another 24%/23% were somewhat satisfied with Uber/Lyft. Only 1%/3% were very or extremely unsatisfied, meaning nearly all users were at least somewhat satisfied. The improvement is broad across both platforms and is consistent with better driver supply, lower ETAs and product enhancements, although the survey does not isolate the cause. Higher satisfaction, combined with record engagement, reduces the risk that frequency gains are being purchased at the expense of service quality.
Subscription Adoption Reaches A Record High:
We think as Uber and Lyft see better attachment within their subscriptionservices, consumer engagement will likely increase. Subscriptions can make the services more useful and harder to replace. They can also lift frequency by bundling mobility, delivery and service benefits. 41% of ridesharing users subscribe to Uber One or Lyft Pink, up from 38% last year and the highest result in the survey, suggesting loyalty products are becoming more mainstream among active riders. Lyft Pink posted the largest increase among subscribers, rising 11pts Y/Y to 34%, from 23%, while dual subscription increased 10pts to 26%. Uber One remained dominant at 92%, broadly stable versus 93% last year, suggesting that this year's incremental subscription adoption was concentrated in Lyft Pink and dual subscriptions. “SavingMoney” remained the top reason for subscribing at 25%, up 4pts Y/Y, even as “Cheapest” fell 2pts to 10%. We do not view this as contradictory: subscribers appear to distinguish between the lowest price on an individual ride and the total value generated by a membership through recurring discounts, lower fees, and benefits across multiple services.
Scheduled Ride Adoption Reaches Record Highs:
Scheduled ride adoption continued to rise for both platforms. Uber Reserve usage increased 3pts Y/Y to a record 56%, while Lyft Scheduled Rides rose 5pts to a record 48%, indicating that advance booking is becoming an increasingly mainstream feature. Frequency among scheduled-ride adopters softened, but broader adoption kept the implied high-frequency user base approximately stable. Among scheduled-ride users, 42% used Uber Reserve daily or weekly and 44% used Lyft Scheduled Rides at that cadence, down from 46%/51% last year. Because adoption increased, the implied share of all Uber/Lyft users using scheduled rides at least weekly remained approximately 24%/21%, versus roughly 24%/22% last year. We view rising adoption alongside an approximately stable implied high-frequency base as constructive. These are self-reported survey results and should not be treated as platform transaction data. As scheduled rides scale, added convenience and greater pickup certainty could support incremental trip frequency and potentially favorable pricing or take rates on high-intent trips.
Record-High Engagement For Both Uber/Lyft While Future Intent Remains Resilient:
Uber maintained a slightly more engaged user base, with 37% of respondents using the service at least weekly, up 4pts Y/Y from 33%, versus Lyft at 34%, also up 4pts from 30%. Both represented record-high engagement levels in our survey. Looking forward, usage intentions remained resilient and improved modestly for both platforms. Approximately 29%/30% of Uber/Lyft users expect to increase their usage significantly or modestly over the next 12 months, versus 28%/27% last year, with Lyft posting the larger Y/Y improvement. The improvement was driven by higher daily usage and a meaningful reduction in low-frequency users. Daily usage increased to 14% for Uber and 11% for Lyft, from 11%/8% last year, while less-than-monthly usage declined to 42%/43%, from 45%/48%. We view this mix shift as particularly constructive, as it suggests users are increasingly incorporating ridesharing into their regular transportation habits. The vast majority of respondents expect usage to remain stable or increase. All in, we are encouraged by the combination of record current engagement, fewer low-frequency users, and resilient forward intent. Uber continues to have the slightly more engaged user base, while Lyft showed greater improvement in future usage expectations. We believe the results reinforce ridesharing’s increasingly habitual and utility-like value proposition and remain supportive of durable trip growth for both platforms.
Waymo Trial Moderates Y/Y, But RemainsAbove 2024 Levels:
The AV launch pipeline has broadened materially across partners, markets, and geographies, with more than 20 announced, testing, or launched programs involving AV partners including Waymo, Wayve, Zoox, etc. from 2026–2028+. 26% of ridesharing users reported having taken a Waymo ride over the last 12 months, down 4pts from 30% last year but still 5pts above the 21% reported in 2024. The survey respondent mix shifted 4pts from Suburban to Rural residents, which may have contributed to the decline because robotaxi availability is concentrated in urban and suburban markets; however, the survey does not establish causality. Rising safety concerns among non-users may also be a factor. Uber has the broader AV partner and geographic pipeline, while Lyft’s smaller pipeline is beginning to produce tangible launches. We view the growing number of AV developers seeking distribution through ridesharing platforms as supportive of Uber and Lyft’s potential role as demand aggregators. The key next proofpoints will be whether these announced programs convert into scaled commercial service and whether the platforms can capture attractive economics as AV supply expands. The expanding AV launch calendar is likely the more important forward indicator for AV adoption, in our view. As Waymo and other AV providers enter additional cities, broader availability should create more opportunities for consumer trial. The next question is whether geographic expansion can push reported usage above the current roughly one-quarter level and convert initial trial into recurring rides.
Waymo Appeal Remains Strong Among Users; Availability Is Still The Primary Barrier, AlthoughSafety Concerns Rise:
Among respondents who have taken a Waymo, 74% indicated they would pay more and 72% would wait longer for a Waymo versus a regular Uber or Lyft ride. Both measures declined from 79%/78% last year, but remain high and continue to suggest meaningful consumer satisfaction and perceived product differentiation among users. That said, the Y/Y moderation indicates willingness to pay a premium or accept added wait time is strong, but not unlimited. Interest among non-users improved modestly, but views became more polarized. 46% were very or somewhat likely to choose a Waymo at the same price, up from 44% last year. The neutral cohort fell to 22% from 35%, while the somewhat/very unlikely cohort rose to 32% from 21%. Positive intent still exceeds negative intent, but consumer resistance has become more visible. Availability remains the clear #1 gating factor, cited by 66% of non-users. However, safety concerns increased materially to 20% from 8% and now nearly match lack of interest at 22% as the second-largest barrier. Cost and wait times remain relatively minor concerns at 9% and 5%, respectively. All in, the results suggest Waymo’s core product continues to resonate strongly once consumers experience it, and broader availability should create additional trial opportunities. However, supply expansion alone may not be sufficient to drive mass adoption; Waymo and its ridesharing partners will also need to reinforce consumer trust and demonstrate consistently safe service as deployments enter new markets.
Waymo California Trip Growth Has Plateaued Since October 2025:
Waymo's California trip trajectory appears to have plateaued in recent months, with monthly trips remaining in a roughly 1.2MM-1.5MM range since October 2025 after a period of rapid growth. June trips declined 7.3% M/M to 1.35MM; adjusting for June's 30 days versus 31 in May, the daily run rate fell approximately 4.2%. The June daily run rate was still about 14% above October 2025, indicating that growth has materially decelerated rather than fully stopped. Potential explanations include slower incremental fleet deployment, allocation of vehicles and operating resources toward new-market launches (breadth over depth), and increasing maturity within Waymo's existing California footprint. The sharp June 2025 decline and July rebound may reflect a temporary operating or reporting anomaly and should not be treated as a normal seasonal pattern without further disclosure.