美国回收细分领域入门指南
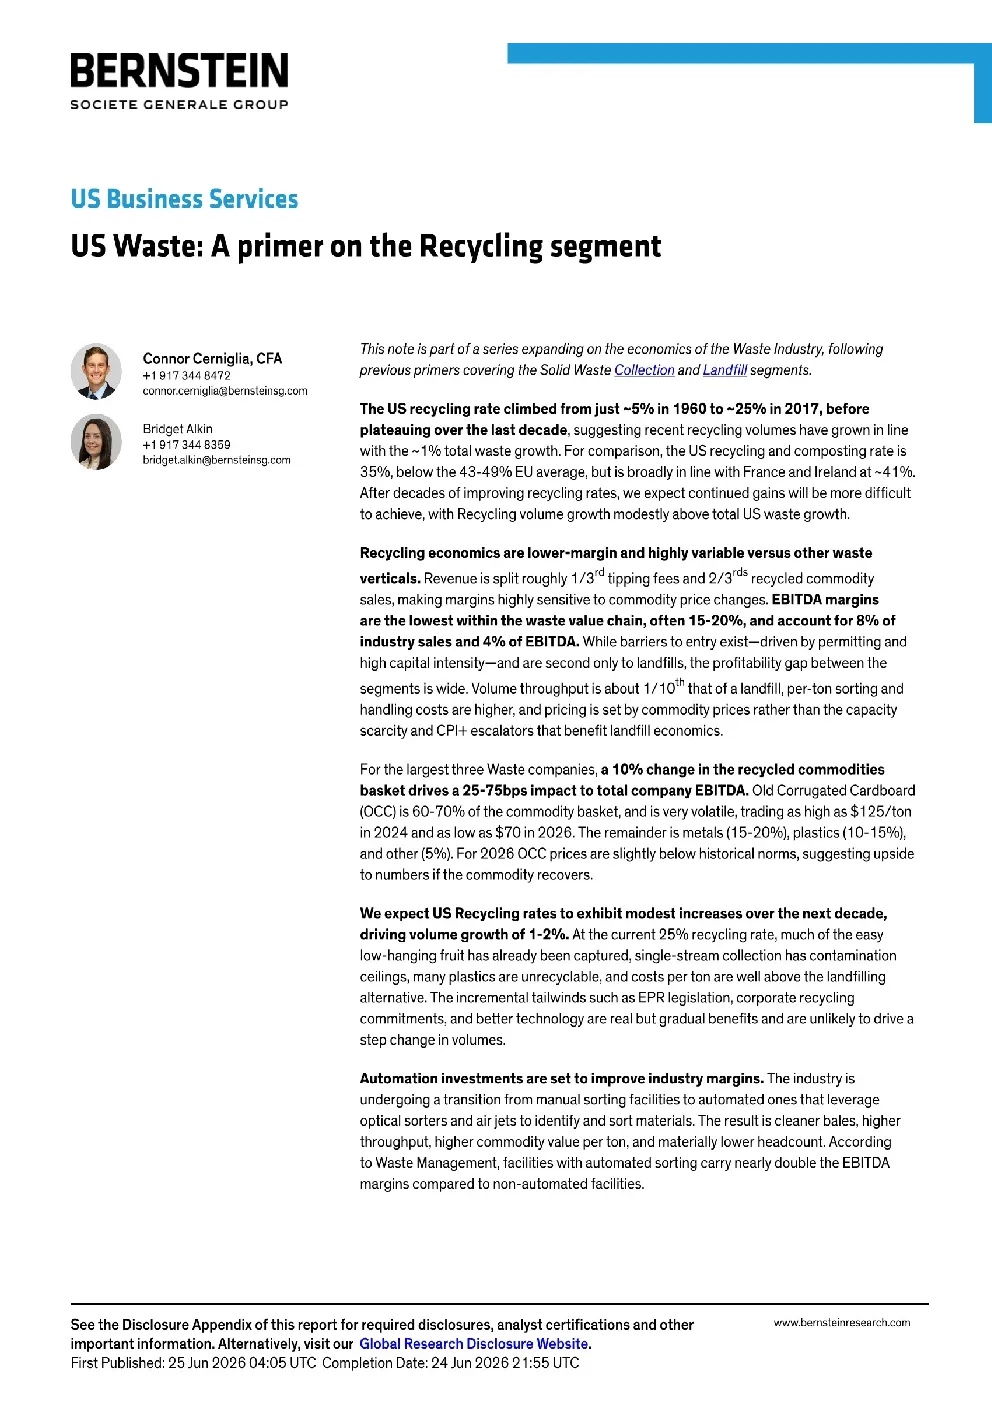
previous primers coveringthe Solid WasteCollection andLandillsegments.TheUSrecyclingrateclimbed fromjust~5%in1960to~25% in2017,before connor.cerniglia@bernsteinsg.comBridget Alkin plateauing over the last decade,suggesting recent recycling volumes have grown in linewiththe~1% total waste growth.For comparison,the US recycling and composting rate is35%,belowthe43-49%EUaverage, butis broadlyin line withFrance and Irelandat~41%After decades of improving recycling rates, we expect continued gains will be more difficultto achieve, with Recycling volume growth modestly above total US waste growth. bridget.alkin@bernsteinsg.com verticals. Revenue is split roughly 1/3rd tipping fees and 2/3rds recycled commodity sales, making margins highly sensitive to commodity price changes. EBITDA marginsare thelowest withinthe waste value chain,often 15-20%,and accountfor 8%ofindustry sales and 4% of EBITDA. While barriers to entry exist-driven by permitting andhigh capital intensity-and are second only to landfills, the profitability gap between thesegments is wide. Volume throughput is about 1/1ot" that of a landfill, per-ton sorting andscarcity and CPl+ escalators that benefit landfill economics. basketdrivesa 25-75bps impacttototalcompanyEBITDA.Old Corrugated Cardboard(OCC) is 60-70% of the commodity basket, and is very volatile, trading as high as $125/tonin 2024 and as low as $70 in 2026.The remainderis metals (15-20%),plastics(10-15%),to numbers if the commodity recovers. We expectUsRecycling rates to exhibitmodest increases overthe next decade,driving volume growth of 1-2%. At the current 25% recycling rate, much of the easylow-hanging fruit has already been captured, single-stream collection has contaminationceilings,many plastics are unrecyclable, and costs perton are wellabove the landfillingalternative. The incremental tailwinds such as EPR legislation, corporate recyclingcommitments,and bettertechnology are real but gradual benefits and are unlikely to drive astep change involumes. Automation investments are setto improve industry margins.The industry isundergoing a transition from manual sortingfacilities to automated onesthat leverageoptical sorters and air jets to identify and sort materials. The result is cleaner bales, higherthroughput, higher commodity value per ton, and materially lower headcount. Accordingto Waste Management, facilities with automated sorting carry nearly double the EBITDAmarginscomparedtonon-automatedfacilities represents ~8% of industry revenue and ~4% of EBITDA, making up a small portion of total company profitability. We wouldnote, however, that the segment garners more attention than the 4% suggests,and is often a focus of shorter-term investors,particularly around earnings. The Recycling segment is theleast profitable among the waste verticals, tied with TransferStations, with EBITDA margins of 15-20%.Recycling rates should improve modestly,meaning volumes likely grow 1-2% overthe next decade, with pricing dictated by end market commodity prices, which are highly variable and tied primarily to OcCpricing. We find the Recycling segment less attractive than the Landilland Collection segments, however Waste Management, Republicthe EBITDA margins of traditional ones, with the companies in the initial stages of adoption, suggesting an improved marginoutlook in the medium term. With healthy volumes and improving profitability we expect the unit economics of the segment toimprove from here, but admit OcC pricing, and by extension containerboard mill capacity and consumer demand, are importantandunpredictableuncontrollablesthat impactprofitability Services Market-Perform with a $220 PT. At itsmostbasicleveltheMunicipalSolidWasteindustrycollectswastefromhomes,businesses,andindustrialsitesand disposes of it through a recycling facility or landfill, with the latter often monetizing the methane gas it naturally emits. Theindustry is typically divided into 5 segments: 1) Collection (Residential, Commercial, and Industrial), 2) Transfer Stations, 3)Recycling, 4) Landfills, and 5) Renewables.Material Re Within Traditional Solid Waste the Collection segment is the largest (55-65% of sales), followed by Landills (20%), TransferStations (10%), Recycling (5-10%),and Renewable Energy (<3%) (Exhibit 2).Recycling economics are theleastattractivein the waste valuechain with an EBITDAmargin of15-20%,closer to that of Transfer Stations, andwell below Landfillprofitability of 40-50% (Exhibit 3). EXHIBIT 3: Recycling EBITDA margins are the lowestcomparedtoothersegments at15-20% policies that increased curbside programs through the 1990s and 2000s and a nationwide shift to single-stream collection(Exhibit 4). In January 2018 China enacted the National Sword policy, banning imports of mixed paper and scrap plastic,upending the export market that supported recycling economics in the US. Simultaneously,the US stopped reporting recyclingEU average (35% US versus 43-49% EU) (Exhibit 5).After decades