亚洲汽车行业:蔚来公司目标价上调
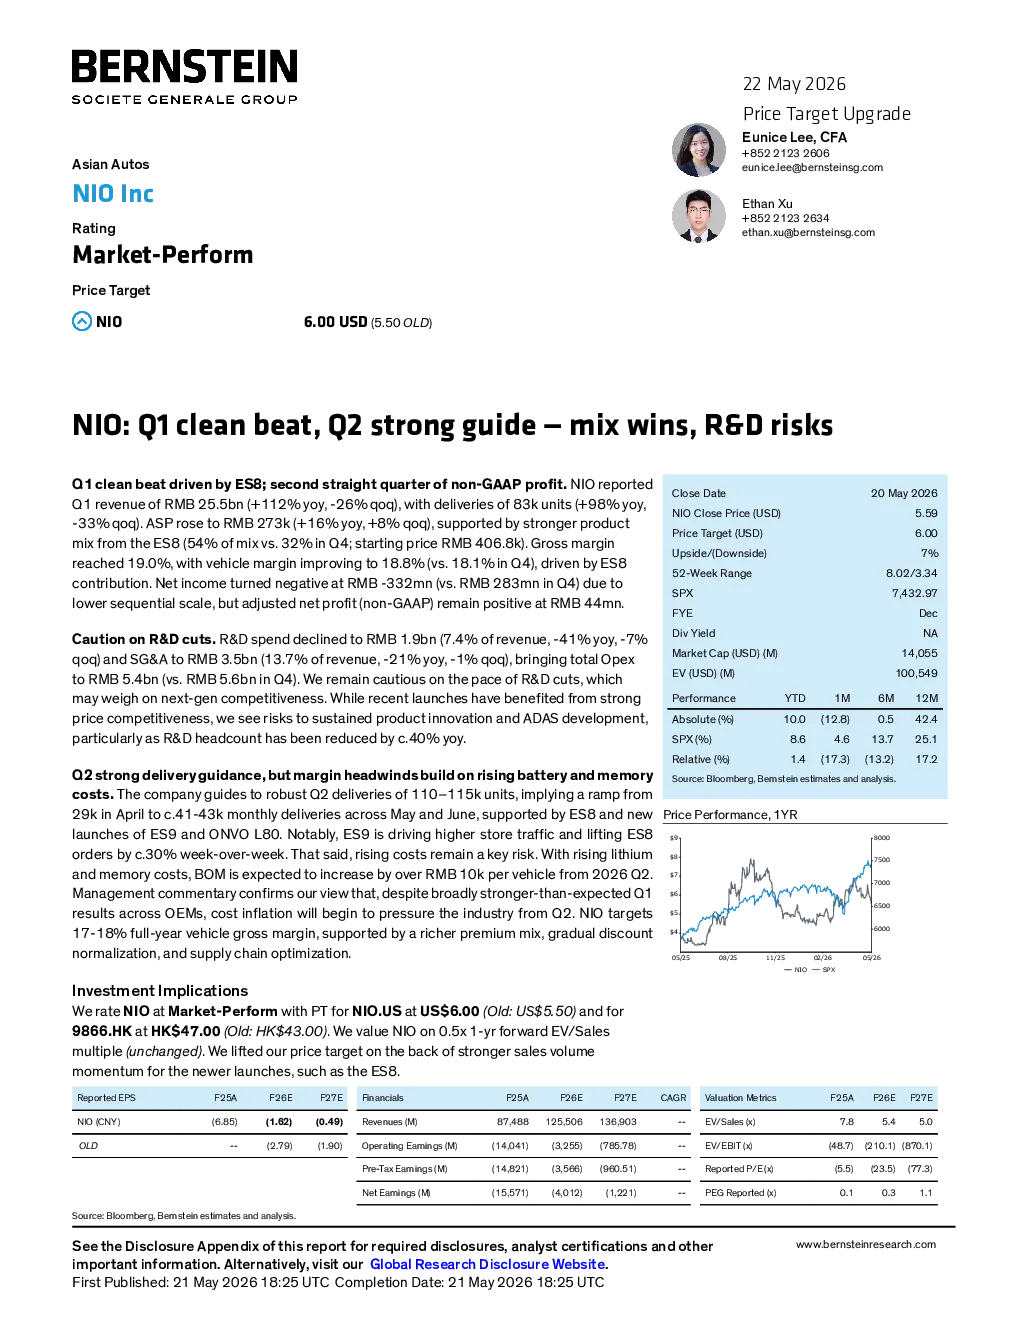
Ethan Xu+852 2123 2634ethan.xu@bernsteinsg.com RatingMarket-Perform Price Target NIO 6.00 USD(5.50OLD) NIO: Q1 clean beat, Q2 strong guide — mix wins, R&D risks Q1 clean beat driven by ES8; second straight quarter of non-GAAP profit.NIO reportedQ1 revenue of RMB 25.5bn (+112% yoy, -26% qoq), with deliveries of 83k units (+98% yoy,-33% qoq). ASP rose to RMB 273k (+16% yoy, +8% qoq), supported by stronger productmix from the ES8 (54% of mix vs. 32% in Q4; starting price RMB 406.8k). Gross marginreached 19.0%, with vehicle margin improving to 18.8% (vs. 18.1% in Q4), driven by ES8contribution. Net income turned negative at RMB -332mn (vs. RMB 283mn in Q4) due tolower sequential scale, but adjusted net profit (non-GAAP) remain positive at RMB 44mn. Caution on R&D cuts.R&D spend declined to RMB 1.9bn (7.4% of revenue, -41% yoy, -7%qoq) and SG&A to RMB 3.5bn (13.7% of revenue, -21% yoy, -1% qoq), bringing total Opexto RMB 5.4bn (vs. RMB 5.6bn in Q4). We remain cautious on the pace of R&D cuts, whichmay weigh on next-gen competitiveness. While recent launches have benefited from strongprice competitiveness, we see risks to sustained product innovation and ADAS development,particularly as R&D headcount has been reduced by c.40% yoy. Q2 strong delivery guidance, but margin headwinds build on rising battery and memorycosts.The company guides to robust Q2 deliveries of 110–115k units, implying a ramp from29k in April to c.41-43k monthly deliveries across May and June, supported by ES8 and newlaunches of ES9 and ONVO L80. Notably, ES9 is driving higher store traffic and lifting ES8orders by c.30% week-over-week. That said, rising costs remain a key risk. With rising lithiumand memory costs, BOM is expected to increase by over RMB 10k per vehicle from 2026 Q2.Management commentary confirms our view that, despite broadly stronger-than-expected Q1results across OEMs, cost inflation will begin to pressure the industry from Q2. NIO targets17-18% full-year vehicle gross margin, supported by a richer premium mix, gradual discountnormalization, and supply chain optimization. Investment Implications We rateNIOatMarket-Performwith PT forNIO.USatUS$6.00(Old: US$5.50)and for9866.HKatHK$47.00(Old: HK$43.00). We value NIO on 0.5x 1-yr forward EV/Salesmultiple(unchanged). We lifted our price target on the back of stronger sales volumemomentum for the newer launches, such as the ES8. DETAILS FINANCIAL FORECAST AND ESTIMATE CHANGES We raised our revenue forecast for 2026/ 2027 by 12%/ 10%, respectively, reflecting NIO’s strong product cycle andcompetitiveness in the premium market. We now forecast the company to achieve 443k and 506k units in 2026 and 2027,respectively. Driven by a favorable product mix shift, improved supply chain efficiency, stronger scale economies, anddisciplined opex control, we increased our EBIT forecast. Our loss per ADS estimates are now RMB 1.62 and RMB 0.49 for2026 and 2027, respectively. Exhibit 13 is a summary of our estimate changes. We remain Market-Perform on NIO with PT forNIO.USatUS$6.00(Old: US$5.50)and for9866.HKatHK$47.00(Old: HK$43.00)., based on 0.5x 1-yr forward EV/sales multiple. EXHIBIT 5:Sales contribution from NIO ES8 (RMB406.8k+) surged to 54% in Q1 26 from 32% in Q4 25,signifcantly boosted the product mix for the quarter EXHIBIT 7:Operating profit declined back into negativeterritory at RMB -309mn and operating margin came inat -1.2% in Q1 26, compared to -53.3% in Q1 25 and 2.3%in Q4 25 EXHIBIT 8:R&D expenses were RMB 1.9bn for Q1 26,representing 7.4% of revenue, up from 5.8% in Q4 25but still lower than 26.4% in Q1 25 EXHIBIT 9:SG&A expenses arrived at RMB 3.5bn in Q1 26,implying 13.7% of revenue, up from 10.2% in Q4 25 butsignificantly down from 36.6% in Q1 25 EXHIBIT 12:The utilization rate of NIO’s battery swapping remains largely stable, with 30 swaps per station per dayduring Feb-May in 2026; it takes 60 swaps per station per day to breakeven, according to the company APPENDIX - FINANCIAL FORECASTS BERNSTEIN TICKER TABLE I. REQUIRED DISCLOSURES References to "Bernstein" or the “Firm” in these disclosures relate to the following entities: Bernstein Institutional Services LLC(April 1, 2024 onwards), Sanford C. Bernstein & Co., LLC (pre April 1, 2024), Bernstein Autonomous LLP, BSG France S.A. (April 1,2024 onwards), Sanford C. Bernstein (Hong Kong) Limited盛博香港有限公司,Sanford C. Bernstein (Canada) Limited, SanfordC. Bernstein (India) Private Limited (SEBI registration no. INH000006378), Sanford C. Bernstein (Singapore) Private Limited,Sanford C. Bernstein Japan KK(サンフォード・C・バーンスタイン株式会社)and analysts employed by Société GénéraleAfrica Technologies & Services to produce Bernstein research under a Global Services Agreement in place between Bernsteinand Société Générale. Bernstein is part of a joint venture between Société Générale (SG) and AllianceBernstein, L.P. (AB). Unless specifically notedotherwise, for purposes of these disclosures, references to Bernstein’s “affi