高频监控:通胀恐慌
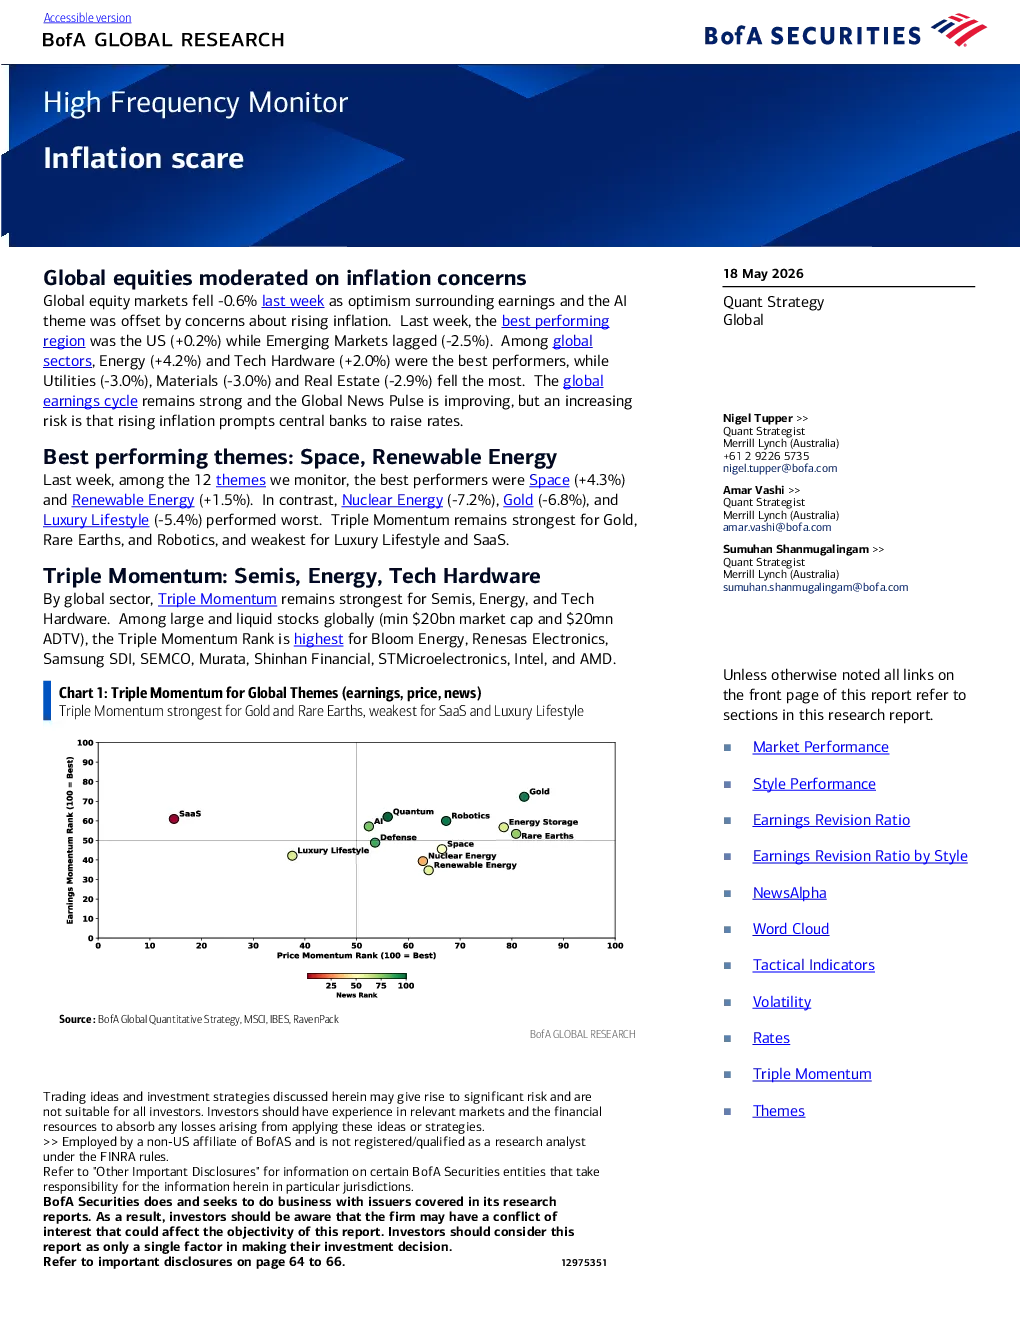
Inflation scare Global equities moderated on inflation concerns 18 May 2026 Global equity markets fell-0.6%last weekas optimism surrounding earnings and the AItheme was offset by concerns about rising inflation. Last week, thebest performingregionwas the US (+0.2%) while Emerging Markets lagged (-2.5%). Amongglobalsectors, Energy (+4.2%) and Tech Hardware (+2.0%) were the best performers, whileUtilities (-3.0%), Materials (-3.0%) and Real Estate (-2.9%) fell the most. Theglobal Quant StrategyGlobal Nigel Tupper>>Quant StrategistMerrill Lynch (Australia)+61 2 9226 5735 Best performing themes: Space,Renewable Energy Last week, among the 12themeswe monitor, the best performers wereSpace(+4.3%)andRenewable Energy(+1.5%). In contrast,Nuclear Energy(-7.2%),Gold(-6.8%), and Luxury Lifestyle(-5.4%) performed worst. Triple Momentum remains strongest for Gold,Rare Earths, and Robotics, and weakest for Luxury Lifestyle and SaaS. Amar Vashi>>Quant StrategistMerrill Lynch (Australia)amar.vashi@bofa.com Sumuhan Shanmugalingam>>Quant StrategistMerrill Lynch (Australia)sumuhan.shanmugalingam@bofa.com Triple Momentum: Semis,Energy, Tech Hardware By global sector,Triple Momentumremains strongest for Semis, Energy, and TechHardware. Among large and liquid stocks globally (min $20bn market cap and $20mnADTV), the Triple Momentum Rank ishighestfor Bloom Energy, Renesas Electronics,Samsung SDI, SEMCO, Murata, Shinhan Financial, STMicroelectronics, Intel, and AMD. Unless otherwise noted all links onthe front page of this report refer to BofA GLOBAL RESEARCH Trading ideas and investment strategies discussed herein may give rise to significant risk and arenot suitable for all investors. Investors should have experience in relevant markets and the financialresources to absorb any losses arising from applying these ideas or strategies.>> Employed by a non-US affiliate of BofAS and is not registered/qualified as a research analyst Refer to "Other Important Disclosures" for information on certain BofA Securities entities that takeresponsibility for the information herein in particular jurisdictions. BofA Securities does and seeks to dobusiness with issuers covered in its researchreports. As a result, investors should be aware that the firm may have a conflict ofinterest that could affect the objectivity of this report. Investors should consider thisreport as only a single factor in making their investment decision. Contents Notice to Readers:3Market Performance4Market Breadth6Style Performance7Global Wave and Earnings8Earnings Revision Ratio9Quantessential Styles: Earnings Revision Ratio11NewsAlpha12Tactical Indicators15Commodities17Volatility18Fed19Rates20Valuation23Revenue Exposure24Triple Momentum25Global Regions: Triple Momentum Charts29Global Sectors: Triple Momentum Charts32Countries: Triple Momentum Charts40Themes43Performance by Theme43Ranking by Triple Momentum44What’s Improving / Deteriorating?45Global Stocks (Most Important) by Theme47Asia Stocks (Most Important) by Theme49Country Exposure to Themes51 Notice to Readers: The various screens identified in this report are intended to be indicative metrics onlyand may not be used for reference purposes or as a measure of performance for anyfinancial instrument or contract, or otherwise relied upon by third parties for any other The Global News Pulse (and the regional and sectors versions of it) is intended to be anindicative metric only and may not be used for reference purposes or as a measure ofperformance for any financial instrument or contract, or otherwise relied upon by third Please refer to the “Global Quant Publications” page for a summary of all our publishedreports which details methodology on each of the analysis included in this report. Market Performance Chart2:Global Regions Performance: Last WeekBest performing region last week wasthe USA BofA GLOBAL RESEARCH Source :BofA Global Quantitative Strategy, MSCI BofA GLOBAL RESEARCH Source :BofA Global Quantitative Strategy, MSCI Market Breadth Chart9:MSCI AC World Market Cap vs. Equal weighted indexperformance - last 12 months Chart8:MSCI AC World Market Cap vs. Equal weighted indexperformance - last week/MTD/YTD Last 12 months, ACWI index returned 22.5%, while Equal Weighted indexreturned 15.2% Last week, ACWI index returned -0.6%, while Equal Weighted indexreturned -2.2% BofA GLOBAL RESEARCH Source :BofA Global Quantitative Strategy, MSCI Style Performance Source :BofA Global Quantitative Strategy, MSCI, IBES, S&P, Worldscope, BloombergBofA GLOBAL RESEARCH Source :BofA Global Quantitative Strategy, MSCI, IBES, S&P, Worldscope, BloombergBofA GLOBAL RESEARCH Source :BofA Global Quantitative Strategy, MSCI, IBES, S&P, Worldscope, BloombergBofA GLOBAL RESEARCH Global Wave and Earnings Chart18:Global Wave is an amalgamation of seven components (1988 to latest)The Global Wave troughed in Feb-26, and providing positive signal or as a measure of performance for any financial instru