您的浏览器禁用了JavaScript(一种计算机语言,用以实现您与网页的交互),请解除该禁用,或者联系我们。 瑞士信贷:《亚洲工业技术:晴雨表(2026年7-8月)》-发现报告

亚洲工业技术:晴雨表(2026年7-8月)

机械设备 2026-08-31 瑞士信贷 大表哥
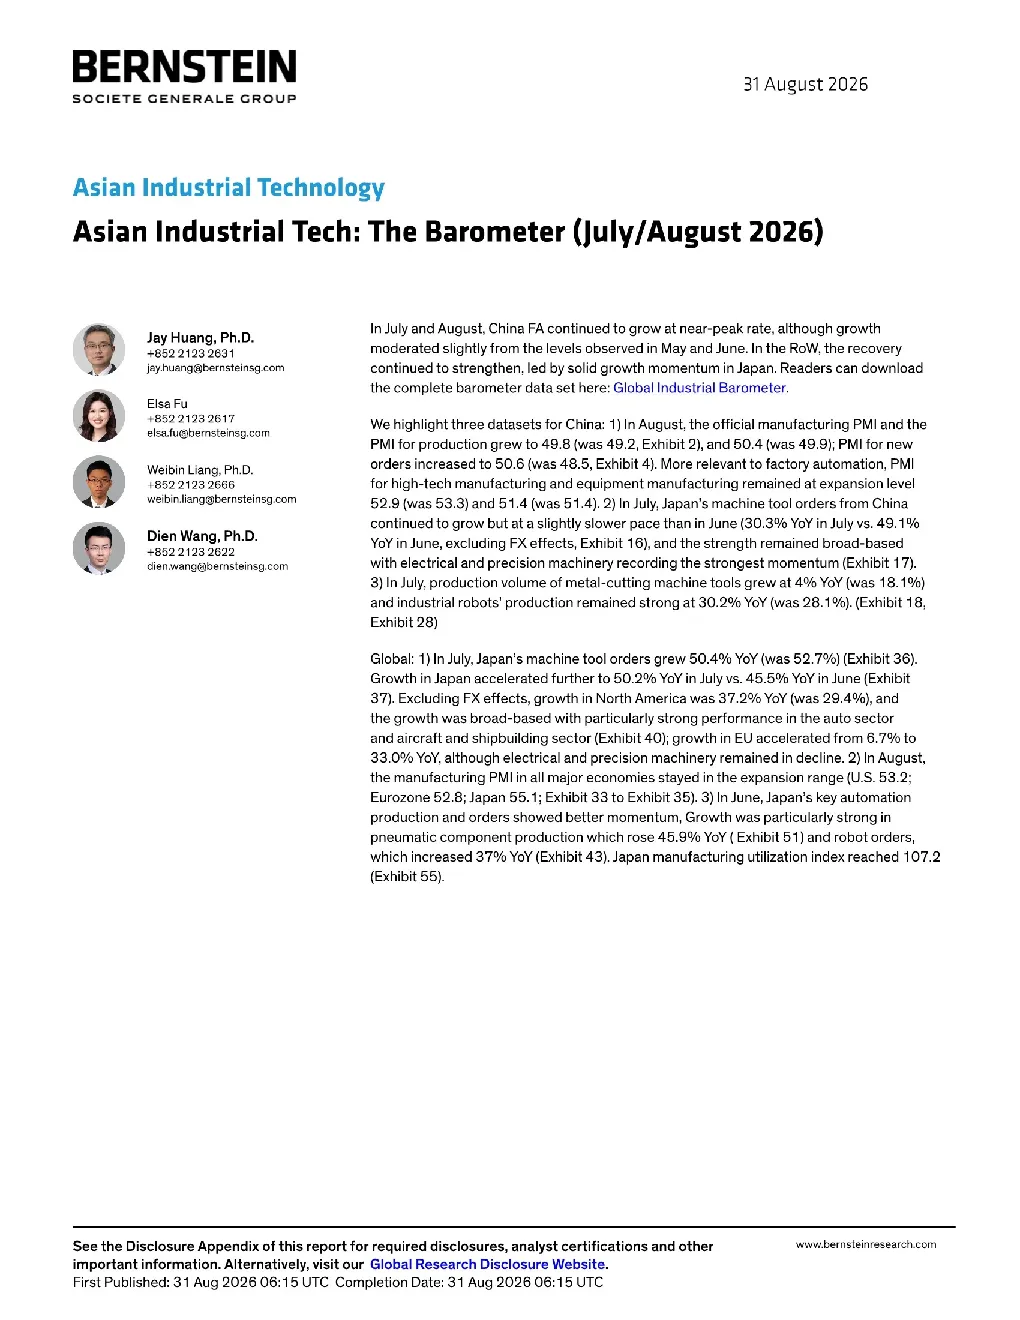
报告封面

Asian Industrial Tech: The Barometer (July/August 2026) moderated slightly from the levels observed in May and June.In the RoW, the recoverycontinuedto strengthen, ledby solid growth momentum in Japan.Readers can downloadthe complete barometer data set here: Global Industrial Barometer. +85221232631jay.huang@bernsteinsg.com +85221232617elsa.fu@bernsteinsg.com PMI for production grew to 49.8 (was 49.2, Exhibit 2), and 50.4 (was 49.9); PMI for neworders increased to 50.6 (was 48.5, Exhibit 4).More relevant to factory automation, PMI52.9 (was 53.3) and 51.4 (was 51.4).2) In July, Japan's machine tool orders from Chinacontinued to grow but at a slightly slower pace than in June (30.3% YoY in July vs. 49.1%YoY in June, excluding FX effects, Exhibit 16), and the strength remained broad-basedwithelectricalandprecisionmachineryrecordingthestrongestmomentum (Exhibit 17)and industrial robots'production remained strong at 30.2% YoY (was 28.1%).(Exhibit 18Exhibit 28) +85221232666weibin.liang@bernsteinsg.com +852 2123 2622dien.wang@bernsteinsg.com Global: 1) In July, Japan's machine tool orders grew 50.4% YoY (was 52.7%) (Exhibit 36).Growth in Japan accelerated further to 50.2% YoY in July vs.45.5% YoY in June (Exhibit37). Excluding FX effects, growth in North America was 37.2% YoY (was 29.4%), andthe growth was broad-based with particularly strong performance in the auto sectorand aircraft and shipbuilding sector (Exhibit 40); growth in EU accelerated from 6.7% tothe manufacturing PMl in all major economies stayed in the expansion range (U.S. 53.2;Eurozone 52.8; Japan 55.1; Exhibit 33 to Exhibit 35).3) In June, Japan's key automationproduction and orders showed better momentum, Growth was particularly strong inpneumatic componentproduction which rose 45.9%YoY(Exhibit51)and robotorders,which increased 37% YoY (Exhibit 43).Japan manufacturing utilization index reached 107.2(Exhibit 55). EXHIBIT1:MomentumTracker EXHIBIT2:ChinamanufacturingPMItrend EXHIBIT 4: China new order, new order/inventory, production and business expectation PMls survey, which is greatly affected by seasonalfactors and has large data fluctuations. The comprehensive index and sub-indices of EPMI currently released areseasonally adjusted data.Source: Wind, Chinese Academy of Science and Technology for Development, PMi, Bernstein analysis Equipment sales and production Japanmachinetoolordergrowthcontributionbreakdownbyindustry(China) series are not always the same as the calculated year-to-year percent changesbecause the monthly YTD volume data comefrom enterprises that are not thesame from year to year whereas the published growth rates are calculated fromenterprises that are the same from year to year.Source: Haver, Bernstein analysis. series are not always the same as the calculated year-to-year percent changesbecause the monthly YTD volume data come from enterprises that are not thesame from yearto year whereas the published growth rates are calculated fromenterprises that are the same from year to year.Source: Haver, Bernstein analysis Note: The published year-to-year percent changes of the monthly YTD volumeseries are not always the same as the calculated year-to-year percent changesbecause the monthly YTD volume data come from enterprises that are not thesame from year to year whereas the published growth rates are calculated fromenterprises that are the same from year to year.Source: Haver, Bernstein analysis. Note: The published year-to-year percent changes of the monthly YTD volumeseries are not always the same as the calculated year-to-year percent changesbecause the monthly YTD volume data come from enterprises that are not thesame from year to year whereas the published growth rates are calculated fromenterprises that are the same from year to year.Source: Haver, Bernstein analysis. outputYTDgrowthCementproducing equipment-industrial outputYTDgrowthMetal-shaping machine tool -industrial series are not always the same as the calculated year-to-year percent changesbecause the monthlyYTD volume data come from enterprises that are notthesame from year to year whereas the published growth rates are calculated fromenterprises that are the same from year to year.Source: Haver, Bernstein analysis. series are not always the same as the calculated year-to-year percent changesbecause the monthly YTD volume data come from enterprises that are not thesame from year to year whereas the published growth rates are calculated fromenterprises that are the same from year to year.Source: Haver; Bernstein analysis. EXHIBIT26:Multiple Unit: Industrial outputYTDgrowth Note: The published year-to-year percent changes of the monthly YTD volumeseries are not always the same as the calculated year-to-year percent changesbecause the monthly YTD volume data come from enterprises that are not thesame from yearto year whereas the published growth rates are calculatedfromenterprises that are the same from year to yearSource: Haver, Bernstein analys