埃克森美孚XOMUS美洲石油:忽略眼前事实,裂解价差隐含油价超90美元/桶
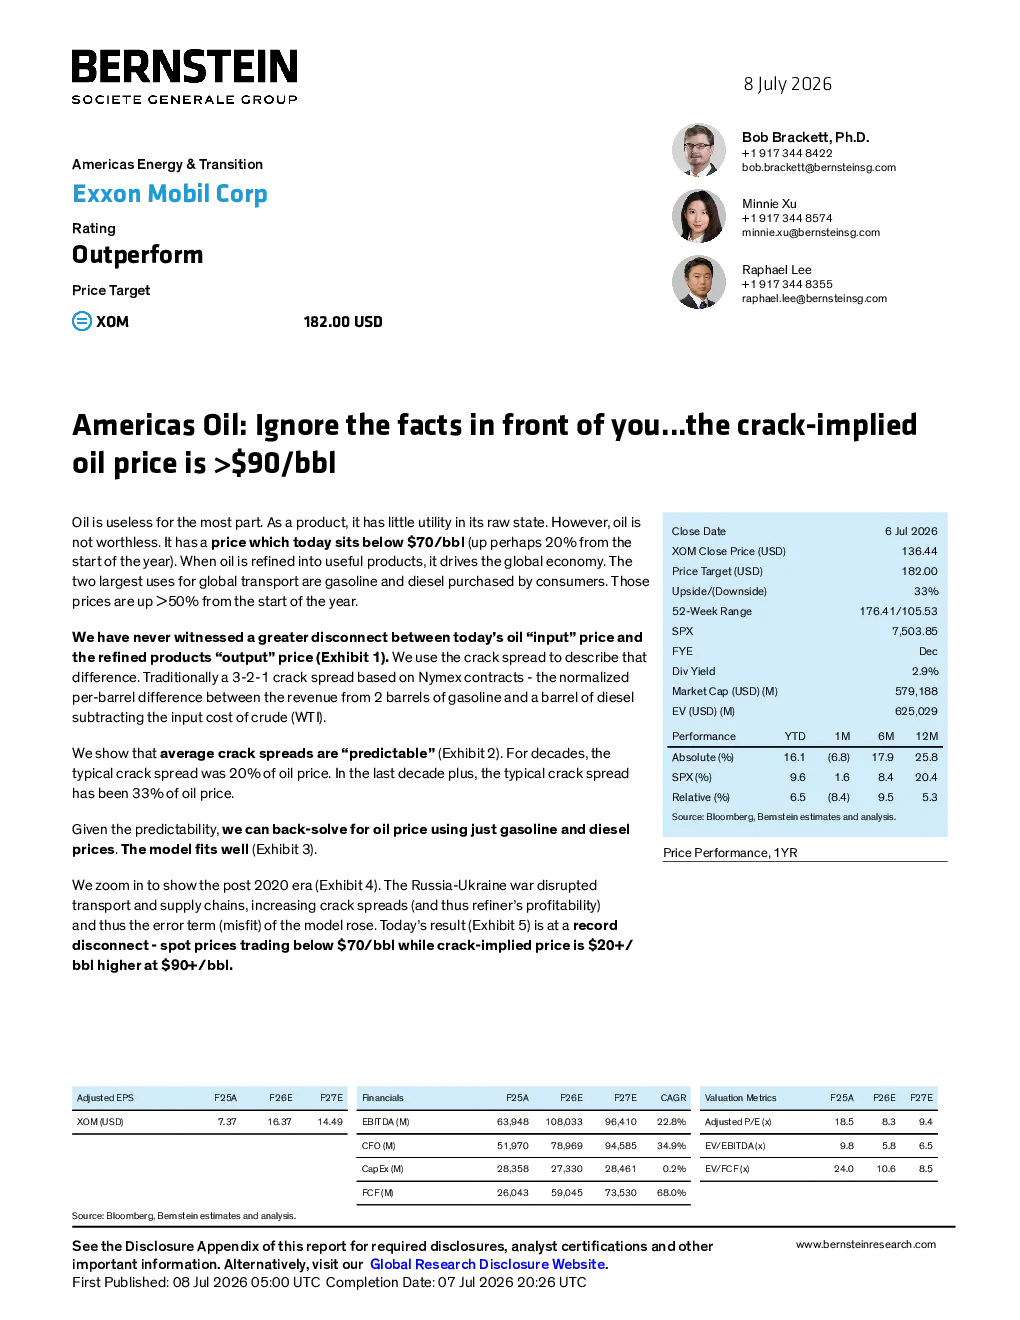
Bob Brackett, Ph.D.+1 917 344 8422bob.brackett@bernsteinsg.com Minnie Xu+1 917 344 8574minnie.xu@bernsteinsg.com Raphael Lee+1 917 344 8355raphael.lee@bernsteinsg.com Price Target Americas Oil: Ignore the facts in front of you...the crack-impliedoil price is >$90/bbl Oil is useless for the most part. As a product, it has little utility in its raw state. However, oil isnot worthless. It has aprice which today sits below $70/bbl(up perhaps 20% from thestart of the year). When oil is refined into useful products, it drives the global economy. Thetwo largest uses for global transport are gasoline and diesel purchased by consumers. Thoseprices are up >50% from the start of the year. We have never witnessed a greater disconnect between today’s oil “input” price andthe refined products “output” price (Exhibit 1).We use the crack spread to describe thatdifference. Traditionally a 3-2-1 crack spread based on Nymex contracts - the normalizedper-barrel difference between the revenue from 2 barrels of gasoline and a barrel of dieselsubtracting the input cost of crude (WTI). We show thataverage crack spreads are “predictable”(Exhibit 2). For decades, thetypical crack spread was 20% of oil price. In the last decade plus, the typical crack spreadhas been 33% of oil price. Given the predictability,we can back-solve for oil price using just gasoline and dieselprices.The model fits well(Exhibit 3). We zoom in to show the post 2020 era (Exhibit 4). The Russia-Ukraine war disruptedtransport and supply chains, increasing crack spreads (and thus refiner’s profitability)and thus the error term (misfit) of the model rose. Today’s result (Exhibit 5) is at arecorddisconnect - spot prices trading below $70/bbl while crack-implied price is $20+/bbl higher at $90+/bbl. While disrupted supply chains can explain part of today’s disconnect, the more importantdistortion is the release of government strategic reserves distorting commercialinventories(Exhibit 6) plus perhaps some ability of the Trump administration to verbally andvisibly talk down prices. Some implications.(1) We continue to be comfortable in a mid-cycle price of oil of $75/bblBrent ($72/bbl WTI). (2) $90/bbl implied oil price should not be sufficient to destroy demandand thus can continue. (3) the Strait is barely re-opened and may not stay open so risks are toupside. (4) refiners (and integrateds with refining businesses) will generate significant excessreturns from the disconnect between oil and crack-implied oil. (5) crack spreads (refiningmargins) can remain elevated for years after supply shocks (e.g., Russia-Ukraine). (6) Theability of governments to physically (i.e., SPR releases) or verbally (i.e., communications) pushdown crude oil price need not be permanent. (7) The desire for governments to eventuallyrebuild strategic inventories can likely generate an SPR put somewhere in the $60s/bbl(near where we are now). The scale of the rebuild could measure in hundreds of thousandsof barrels per year (a significant percentage of expected demand growth) and could last foryears. Despite a historically poor time for entry (mid year) and despite a reasonably balanced marketin the outyears, we still believenow is a good timefor integrated oil exposure (XOM our topchoice) and even E&P exposure (DVN and FANG have the most upside in our coverage). Investment Implications We think integrateds will benefit from this disconnect from cracks and oil price with apreference for XOM. For E&Ps, we prefer FANG and DVN. DETAILS We remind investors that oil price and crack spreads vary over time (WTI futures only started trading in March of 1983 and otherproducts later). Today’s crack spreads remain near record levels while oil prices have pulled back remarkably. A 3-2-1 crack spread based on Nymex contracts - the normalized per-barrel difference between the revenue from 2 barrels ofgasoline and a barrel of diesel subtracting the input cost of crude (WTI). Source: Bloomberg; Bernstein analysis Of course the value of the dollar changes over time. We could apply a CPI deflator to move the data from nominal to real, oralternatively lets consider ratios. We show ratios below. If we arbitrarily pick the start of 2012 as a ‘break’, we find that the average crack spread before was 20%and the average after was 33%. Why 2012? It was around the time when supply fears began to be mitigated by shale growth. Itwas around the time of the Arab Spring. It was around the time of sustained $100/bbl oil. It also makes the end of the bottom ofcrack spreads. In any case, moving the specific choice around doesn’t change the fact that crack spreads have been roughly athird of oil price over the last decade or so. Source: Bloomberg; Bernstein analysis If crack spreads are defined as: Crack = ( 2 x Gas + 1 x Diesel - 3 x Oil ) / 3 then we can ( Crack / Oil ) = a third, we can show easily: Oil = ( 2 x Gas + 1 x Diesel ) / 4 We can plot that formula against actual oil price. Note the fit is p