Capital Flow Observation: Vitamin C
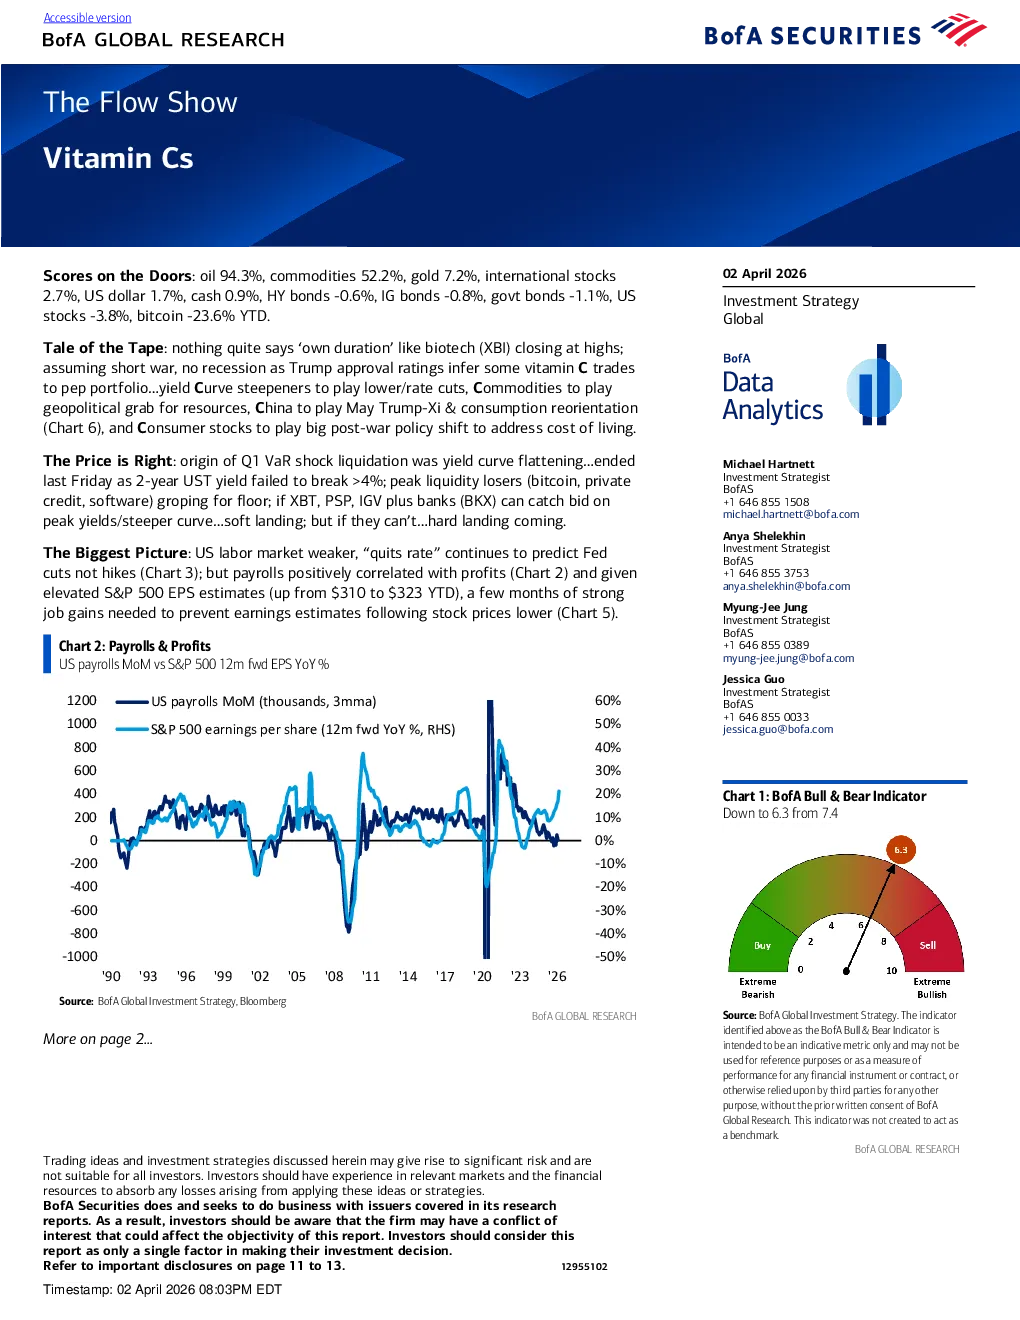
Vitamin Cs Scores on the Doors: oil 94.3%, commodities 52.2%, gold 7.2%, international stocks2.7%, US dollar 1.7%, cash 0.9%, HY bonds -0.6%, IG bonds -0.8%, govt bonds -1.1%, USstocks -3.8%, bitcoin -23.6% YTD. 02 April 2026 Investment StrategyGlobal Tale of the Tape: nothing quite says‘own duration’like biotech (XBI) closing at highs;assuming short war, no recession as Trump approval ratings infer some vitaminCtradesto pep portfolio…yieldCurve steepeners to play lower/rate cuts,Commodities to playgeopolitical grab for resources,China to play May Trump-Xi & consumption reorientation(Chart 6), andConsumer stocks to play big post-war policy shift to address cost of living. The Price is Right: origin of Q1 VaR shock liquidation was yield curve flattening…endedlast Friday as2-year UST yield failed to break >4%; peak liquidity losers (bitcoin, privatecredit, software) groping for floor; if XBT, PSP, IGV plus banks (BKX) can catch bid onpeak yields/steeper curve…soft landing; but if they can’t…hard landing coming. Michael HartnettInvestment StrategistBofAS+1 646 855 1508michael.hartnett@bofa.com Anya ShelekhinInvestment StrategistBofAS+1 646 855 3753anya.shelekhin@bofa.com The Biggest Picture: US labor market weaker,“quits rate”continues to predict Fedcuts not hikes (Chart 3); but payrolls positively correlated with profits (Chart 2) and givenelevated S&P 500 EPS estimates (up from $310 to $323 YTD), a few months of strong Myung-Jee JungInvestment StrategistBofAS+1 646 855 0389myung-jee.jung@bofa.com Jessica GuoInvestment StrategistBofAS+1 646 855 0033jessica.guo@bofa.com Source:BofA Global Investment Strategy. The indicatoridentified above as the BofA Bull & Bear Indicator isintended to be an indicative metric only and may not beused for reference purposes or as a measure ofperformance for any financial instrument or contract, or More on page 2… otherwise relied upon by third parties for any otherpurpose, without the prior written consent of BofA resources to absorb any losses arising from applying these ideas or strategies.BofA Securities does and seeks to do business with issuers covered in its researchreports. As a result, investors should be aware that the firm may have a conflict of Weekly Flows: $11.6bn to stocks, $3.3bn to bonds, $0.9bn to gold (1stinflow in 5weeks), $0.4bn from crypto, $2.0bn from cash. Flows to Know: •IG + HY bonds: $7.9bn combined outflow, biggest since Apr’25 (Chart 8); •Bank loans: $0.2bn inflow, 1stin 6 weeks; •Europe equities: $3.5bn outflow, biggest 2-week outflow ($6.6bn) since Dec’24(Chart 9); •Japan equities: $0.8bn outflow, biggest since Nov’25; •Tech: $2.1bn inflow, biggest in 4 weeks; •Consumer: $1.1bn outflow, biggest since Dec’25. BofA Private Clients: $4.1tn AUM…63.0% stocks (lowest since May'25), 18.6% bonds,11.0% cash; weekly inflows to bonds & cash; note GWIM equity ETF share count up 2%YTD, 1% past 4 weeks, 0.3% past week…underlying equity buying; past 4 weeks, privateclients buying Japan, staples, materials ETFs, selling bank loan, tech, EM debt ETFs. BofA Bull & Bear Indicator: drops to 6.3 from 7.4 (lowest since Jun'25, biggest weeklydrop since Apr'25) on deteriorating global stock index breadth, HY bond outflows, widerspreads in HY bonds & subordinated bank debt; BofA Bull & Bear Indicator contrarian “sell signal”for risk assets ended March 25th(triggered Dec 17th);“old”BofA Bull & Bear Indicator down to 5.7 from 6.5. BofA Global Breadth Rule: net 16% of MSCI ACWI equity indices trading below both50-day & 200-day moving averages, not close to -88%“buy signal”for stocks; mostrecent“oversold”reading was -39% Mar 23rd, most recent“overbought”reading was 89% on Jan 28th; BofA positioning data does not show bull capitulation, argues any rally from recent S&P 500 low struggles to advance above 6.8k (50-day & 100-day MA); thatsaid,“sell the rip”v in vogue as trading consensus right now. On War & Politics: politics continue to argue for short not long war; new lows in Trumpapproval 41%, on economy 37%, on inflation 33%, all correlated with Nov midtermprobability of GOP maintaining control of House (down to 15%) and Senate (down to49% - Chart 5); Senate map tough for DEMs who need to flip four of six races in Maine,North Carolina, Ohio, Iowa, Alaska, Texas, plus defend New Hampshire, Michigan, Georgiaseats; Q2 political/policy risk for markets is trade policy once again becomes US tool topressure friends & foes into support for US geopolitical aims…Trump announcing On Hubris & Humiliation: popular & contentious“skyscraper curse”says completion ofworld’s tallest buildings has coincided with hubristic economic & market tops as bubblespopped and ended misallocation of capital; Chrysler Building in 1930…Oct’29 crash &Great Depression, Sears Tower in 1974…stagflation era (took Dow Jones 10 years tosurpass 1973 high), Petronas Towers in 1996…Asia financial crisis, Burj Khalifa in2009…secular peak in oil prices plus Global Financial Crisis, Shangha