商品贸易晴雨表
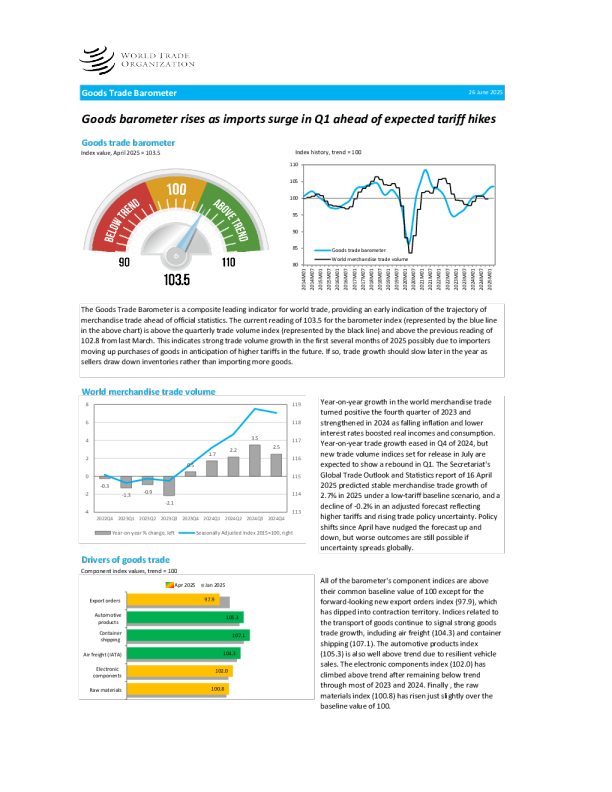
Goods barometer rises as imports surge in Q1 ahead of expected tariff hikes The Goods Trade Barometer is a composite leading indicator for world trade, providing an early indication of the trajectory ofmerchandise trade ahead of official statistics. The current reading of 103.5 for the barometer index (represented by the blue linein the above chart) is above the quarterly trade volume index (represented by the black line) and above the previous reading of102.8 from last March. This indicates strong trade volume growth in the first several months of 2025 possibly due to importersmoving up purchases of goods in anticipation of higher tariffs in the future. If so, trade growth should slow later in the year assellers draw down inventories rather than importing more goods. Year-on-year growth in the world merchandise tradeturned positive the fourth quarter of 2023 andstrengthened in 2024 as falling inflation and lowerinterest rates boosted real incomes and consumption.Year-on-year trade growth eased in Q4 of 2024, butnew trade volume indices set for release in July areexpected to show a rebound in Q1. The Secretariat'sGlobal Trade Outlook and Statistics report of 16 April2025 predicted stable merchandise trade growth of2.7% in 2025 under a low-tariff baseline scenario, and adecline of -0.2% in an adjusted forecast reflectinghigher tariffs and rising trade policy uncertainty. Policyshifts since April have nudged the forecast up anddown, but worse outcomes are still possible ifuncertainty spreads globally. Drivers of goods trade Component index values, trend = 100 All of the barometer's component indices are abovetheir common baseline value of 100 except for theforward-looking new export orders index (97.9), whichhas dipped into contraction territory. Indices related tothe transport of goods continue to signal strong goodstrade growth, including air freight (104.3) and containershipping (107.1). The automotive products index(105.3) is also well above trend due to resilient vehiclesales. The electronic components index (102.0) hasclimbed above trend after remaining below trendthrough most of 2023 and 2024. Finally , the rawmaterials index (100.8) has risen just slightly over thebaseline value of 100. Source: IATA, WorldACD. Source: Federal Reserve Bank of St. Louis, ACEA, JAMA, National Bureauof Statistics China. Source: TDM. Notes Data on international air freight courtesy of the International Air Transport Association (IATA). Airfreight has proved to be a very timely indicator of overall world trade and an early signal of turningpoints in recessions. Further information and analysis available here:https://www.iata.org/en/publications/economics/ Other sources: WTO Secretariat for quarterly merchandise trade volume, TDM Trade Data Monitor database for electroniccomponents and agricultural raw materials, Institute for Shipping Economics and Logistics for container throughput. Exportorders from IHS-Markit Global PMI. The air freight series has been extended with data from WorldACD. Details on the methodology of the trade outlook indicator are available on the WTO website at the following address:https://www.wto.org/english/news_e/news20_e/methodology_wtoi_19aug20_e.pdf Short-term WTO trade statistics (quarterly and monthly) can be obtained here:https://www.wto.org/english/res_e/statis_e/latest_trends_e.htm The WTO issues a separate semi-annual trade forecasts projecting trade growth over two years. The latest releaseis available for download here:https://www.wto.org/english/news_e/news25_e/tfore_16apr25_e.htm


