GEMs funds flows: Net inflows to EM funds reaccelerate
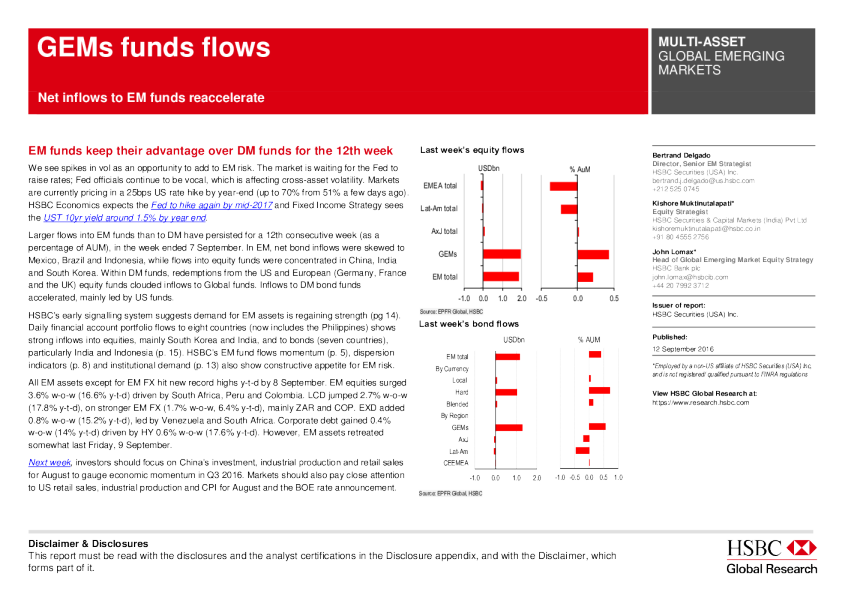
Disclaimer & Disclosures Disclaimer & Disclosures This report must be read with the disclosures and the analyst certifications in the Disclosure appendix, and with the Disclaimer, which forms part of it. EM funds keep their advantage over DM funds for the 12th week We see spikes in vol as an opportunity to add to EM risk. The market is waiting for the Fed to raise rates; Fed officials continue to be vocal, which is affecting cross-asset volatility. Markets are currently pricing in a 25bps US rate hike by year-end (up to 70% from 51% a few days ago). HSBC Economics expects the Fed to hike again by mid-2017 and Fixed Income Strategy sees the UST 10yr yield around 1.5% by year end. Larger flows into EM funds than to DM have persisted for a 12th consecutive week (as a percentage of AUM), in the week ended 7 September. In EM, net bond inflows were skewed to Mexico, Brazil and Indonesia, while flows into equity funds were concentrated in China, India and South Korea. Within DM funds, redemptions from the US and European (Germany, France and the UK) equity funds clouded inflows to Global funds. Inflows to DM bond funds accelerated, mainly led by US funds. HSBC’s early signalling system suggests demand for EM assets is regaining strength (pg 14). Daily financial account portfolio flows to eight countries (now includes the Philippines) shows strong inflows into equities, mainly South Korea and India, and to bonds (seven countries), particularly India and Indonesia (p. 15). HSBC’s EM fund flows momentum (p. 5), dispersion indicators (p. 8) and institutional demand (p. 13) also show constructive appetite for EM risk. All EM assets except for EM FX hit new record highs y-t-d by 8 September. EM equities surged 3.6% w-o-w (16.6% y-t-d) driven by South Africa, Peru and Colombia. LCD jumped 2.7% w-o-w (17.8% y-t-d), on stronger EM FX (1.7% w-o-w, 6.4% y-t-d), mainly ZAR and COP. EXD added 0.8% w-o-w (15.2% y-t-d), led by Venezuela and South Africa. Corporate debt gained 0.4% w-o-w (14% y-t-d) driven by HY 0.6% w-o-w (17.6% y-t-d). However, EM assets retreated somewhat last Friday, 9 September. Next week, investors should focus on China’s investment, industrial production and retail sales for August to gauge economic momentum in Q3 2016. Markets should also pay close attention to US retail sales, industrial production and CPI for August and the BOE rate announcement. Last week’s equity flows Source: EPFR Global, HSBC Last week’s bond flows Source: EPFR Global, HSBC Bertrand Delgado Director, Senior EM Strategist HSBC Securities (USA) Inc. bertrand.j.delgado@us.hsbc.com +212 525 0745 Kishore Muktinutalapati* Equity Strategist HSBC Securities & Capital Markets (India) Pvt Ltd kishoremuktinutalapati@hsbc.co.in +91 80 4555 2756 John Lomax* Head of Global Emerging Market Equity Strategy HSBC Bank plc john.lomax@hsbcib.com +44 20 7992 3712 Issuer of report: HSBC Securities (USA) Inc. Published: 12 September 2016 *Employed by a non-US affiliate of HSBC Securities (USA) Inc, and is not registered/ qualified pursuant to FINRA regulations View HSBC Global Research at: https://www.research.hsbc.com GEMs funds flows MULTI-ASSET GLOBAL EMERGING MARKETS -1.00.01.02.0EM to talGEMsAxJ tota lLat-Am tota lEMEA totalUSDbn-0.50.00.5% AuM-1.00.01.02.0CEEMEALat-AmAxJGEMsBy RegionBlendedHardLocalBy CurrencyEM totalUSDbn-1.0-0.50.00.51.0% AUMNet inflows to EM funds reaccelerate MULTI-ASSET GLOBAL EMERGING MARKETS 12 September 2016 2 Bond fund flows Strong net inflows into EM bond were skewed to EXD and GEM funds. Year-to-date net inflows into bond funds are USD33.65bn, mainly into EXD funds (USD21.8bn) and GEM funds (USD21.7bn). Inflows into EM corporate bond funds continued for a second week, driven by EXD and blended funds (charts 27-28). Investments into EM corporate bond funds amount to USD8.4bn y-t-d. According to the Ministry of Finance, Japanese institutional investors turned net sellers after 10 weeks of buying, selling a net USD12.76bn worth of foreign bonds in the week of 2 September. Foreign bond investment totalled USD4.53bn the previous week. Uridashi bond (retail bond in Japan) issuances during the week ended September was dominated by issuances in BRL (USD30.1m) and INR (USD10.1m). Year-to-date, BRL remains the favourite currency in the EM space with total issuance of USD1.38bn, followed by INR and ZAR. Equity fund flows EM equity funds posted inflows for the tenth consecutive week. Since July, inflows into the asset class totalled USD17.2bn (equivalent to 2.1% of the AuM). During the same period, DM equity funds saw outflows of USD12.6bn (less than 0.2% of AuM). Although EM equity funds have been in favour over the last few weeks, we think this EM trade is not based on conviction. The strong inflow and price performance that the asset class experienced recently came after a prolonged period of outflows and underperformance. In this context, cumulative flow into EM equity funds since 2010 is cu


